
Mathematics, 07.08.2021 17:20 levicorey846
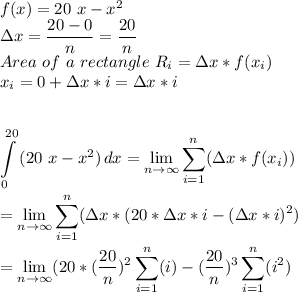
HELPP Sketch the graph of the function y = 20x − x2, and approximate the area under the curve in the interval [0, 20] by dividing the area into the given numbers of rectangles.
Part A
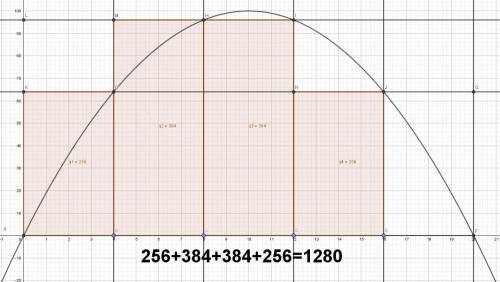
Use five rectangles to approximate the area under the curve.
Part B
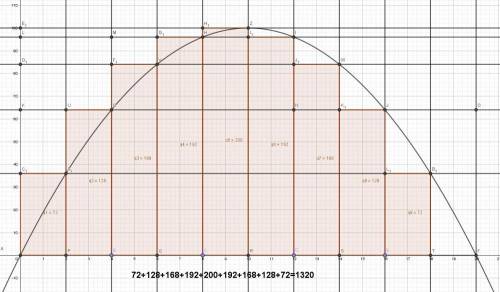
Use 10 rectangles to approximate the area under the curve.
Part C
Calculate the area under the curve using rectangles as their number becomes arbitrarily large (tends to infinity). You do not need to sketch the rectangles.

Answers: 3
![\displaystyle \sum_{i=1}^{n} i= \dfrac{n*(n+1)}{2} \\\\\displaystyle \sum_{i=1}^{n} i^2= \dfrac{n*(n+1)(2n+1)}{6} \\\\\\\int\limits^{20}_0 {(20\ x-x^2)} \, dx =[\dfrac{20\ x^2}{2} -\dfrac{x^3}{3} ]^{20}_0=\dfrac{20^3}{3} =1333.\overline{3}\\\\\\](/tpl/images/1405/7335/9341f.png)


Another question on Mathematics
Mathematics, 21.06.2019 15:20
In exponential growth functions, the base of the exponent must be greater than 1,how would the function change if the base of the exponent were 1? how would the fiction change if the base of the exponent were between 0and 1
Answers: 1
Mathematics, 21.06.2019 20:00
Consider the set of all four-digit positive integers less than 2000 whose digits have a sum of 24. what is the median of this set of integers?
Answers: 1
Mathematics, 21.06.2019 20:00
Sarah took the advertising department from her company on a round trip to meet with a potential client. including sarah a total of 11 people took the trip. she was able to purchase coach tickets for $280 and first class tickets for $1280. she used her total budget for airfare for the trip, which was $6080. how many first class tickets did she buy? how many coach tickets did she buy?
Answers: 1
Mathematics, 21.06.2019 21:30
Find the missing dimension! need asap! tiny square is a =3025 in ²
Answers: 1
You know the right answer?
HELPP Sketch the graph of the function y = 20x − x2, and approximate the area under the curve in the...
Questions


Mathematics, 03.07.2020 03:01
English, 03.07.2020 03:01

Mathematics, 03.07.2020 03:01

Geography, 03.07.2020 03:01
Mathematics, 03.07.2020 03:01

Mathematics, 03.07.2020 03:01
Mathematics, 03.07.2020 03:01
Physics, 03.07.2020 03:01
Mathematics, 03.07.2020 04:01


