5. (09.06 MC)
The graphs of the polar curves r = sin e-2 and r = cos(20 + 3) are shown.
Find...

Mathematics, 14.08.2021 15:10 maggie2018
5. (09.06 MC)
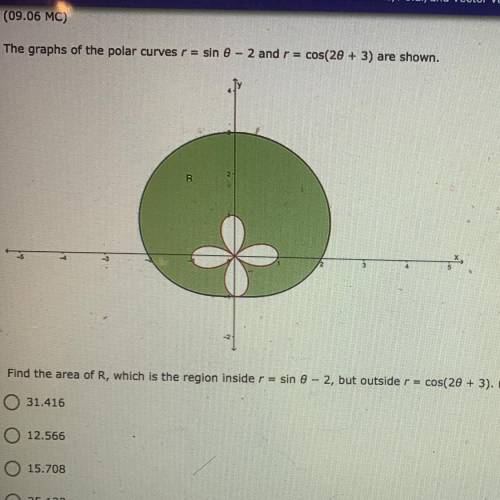
The graphs of the polar curves r = sin e-2 and r = cos(20 + 3) are shown.
Find the area of R, which is the region inside r = sin 6-2, but outside r = cos(20 + 3). (10 points)
31.416
12.566
15.708
0 25.133

Answers: 3


Another question on Mathematics
Mathematics, 21.06.2019 15:30
Consider the system: y = 3x + 5 y = ax + b what values for a and b make the system inconsistent? what values for a and b make the system consistent and dependent? explain
Answers: 1
Mathematics, 21.06.2019 15:40
What is the first quartile of the data set? 10, 11, 12, 15, 17, 19, 22, 24, 29, 33, 38 a. 12 b. 19 c. 29 d. 10
Answers: 1
Mathematics, 21.06.2019 16:30
Hi my sisters and brothers can tell me the answer because i don’t understand the question
Answers: 1
Mathematics, 21.06.2019 20:30
What is the interquartile range of this data set? 2, 5, 9, 11, 18, 30, 42, 48, 55, 73, 81
Answers: 1
You know the right answer?
Questions

Chemistry, 19.10.2019 18:10

Biology, 19.10.2019 18:10

Biology, 19.10.2019 18:10


Mathematics, 19.10.2019 18:10

Biology, 19.10.2019 18:10
Mathematics, 19.10.2019 18:10
Mathematics, 19.10.2019 18:10
English, 19.10.2019 18:10

Health, 19.10.2019 18:10


