
Mathematics, 15.08.2021 06:20 gggggg47
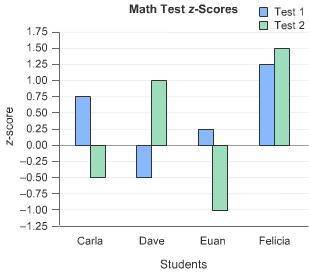
The bar graph shows the z-score results of four students on two different mathematics tests. The students took Test 1 and then, a month later, took Test 2. Which student had the lowest score on Test 2? Euan Felicia Dave Carla

Answers: 3


Another question on Mathematics
Mathematics, 22.06.2019 00:00
Answer asap! show all work! find the number of complex roots, the possible number of real roots and the possible rational roots of the polynomial function. then, solve for all roots. x^3 + 2x^2 + 3x + 6 = 0
Answers: 1
Mathematics, 22.06.2019 00:20
Data for the height of a model rocket launch in the air over time are shown in the table. darryl predicted that the height of the rocket at 8 seconds would be about 93 meters. did darryl make a good prediction? yes, the data are best modeled by a quadratic function. the value of the function at 8 seconds is about 93 meters. yes, the data are best modeled by a linear function. the first differences are constant, so about 93 meters at 8 seconds is reasonable. no, the data are exponential. a better prediction is 150 meters. no, the data are best modeled by a cubic function. a better prediction is 100 meters.
Answers: 2
Mathematics, 22.06.2019 01:00
Find the average rate of change for the given function drom x=1 to x=2
Answers: 1
You know the right answer?
The bar graph shows the z-score results of four students on two different mathematics tests. The stu...
Questions

Social Studies, 06.03.2021 02:00

Chemistry, 06.03.2021 02:00

Mathematics, 06.03.2021 02:00
Social Studies, 06.03.2021 02:00

Mathematics, 06.03.2021 02:00

Biology, 06.03.2021 02:00
Mathematics, 06.03.2021 02:00
Mathematics, 06.03.2021 02:00

Mathematics, 06.03.2021 02:00


