
Mathematics, 16.08.2021 02:10 itscheesycheedar
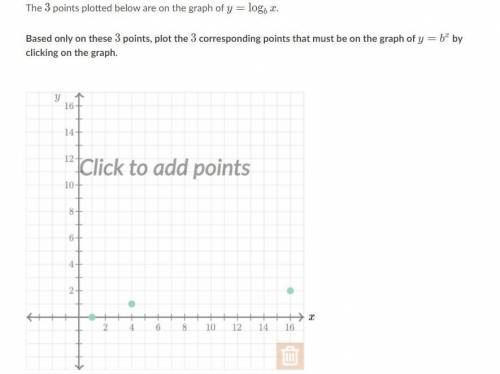
The 3 points plotted below are on the graph of y = logbx. Based only on these 3 points, plot the 3 corresponding points that must be on the graph of y = b^x by clicking on the graph.

Answers: 2


Another question on Mathematics
Mathematics, 21.06.2019 13:30
Rose drew a regression line for this paired data set. her line passed through (1, 2) and (3, 5) . what is the equation of rose's regression line?
Answers: 1
Mathematics, 21.06.2019 18:20
What is the solution set of the quadratic inequality x^2-5< or equal to 0
Answers: 1
Mathematics, 21.06.2019 23:40
The frequency table shows the results of a survey asking people how many hours they spend online per week. on a piece of paper, draw a histogram to represent the data. then determine which answer choice matches the histogram you drew. in order here is the.. hours online: 0-3, 4-7, 8-11, 12-15, and 16-19. frequency: 5, 8, 10, 8, 7 answer for the question is in the picture! : )
Answers: 2
You know the right answer?
The 3 points plotted below are on the graph of y = logbx. Based only on these 3 points, plot the 3 c...
Questions


History, 09.06.2020 04:57
Mathematics, 09.06.2020 04:57

German, 09.06.2020 04:57

Mathematics, 09.06.2020 04:57

Health, 09.06.2020 04:57
Mathematics, 09.06.2020 04:57
Mathematics, 09.06.2020 04:57
Mathematics, 09.06.2020 04:57


