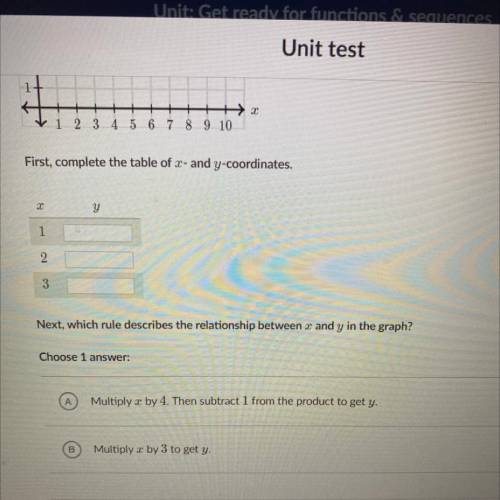
The points on the following graph shows the relationship between 3 and y.
у
101
.
7-
6+
.
4-
3+ .
2
1
+
+2
1 2 3 4 5 6 7 8 9 10
First, complete the table of 2- and y-coordinates.
y
1
2
3
No commitments. Cancel anytime. All pricing is in US dollars (USD). The subscriptoin renews automaticaly until you cancel. For more information read our Terms of use & Privacy Policy