Mathematics, 24.08.2021 01:00 jessv01
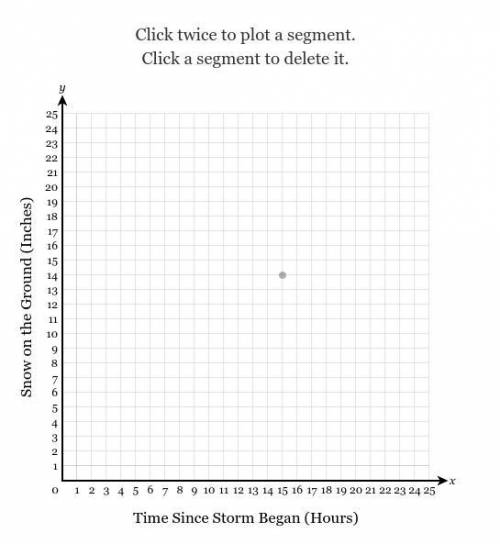
During a snowstorm, Taylor tracked the amount of snow on the ground. When the storm began, there were 5 inches of snow on the ground. Snow fell at a constant rate of 1 inch per hour until another 5 inches had fallen. The storm then stopped for 6 hours and then started again at a constant rate of 2 inches per hour for the next 5 hours. As soon as the storm stopped again, the sun came out and melted the snow for the next 3 hours at a constant rate of 3 inches per hour. Make a graph showing the inches of snow on the ground over time using the data that Taylor collected.


Answers: 3


Another question on Mathematics

Mathematics, 21.06.2019 14:00
F(x) = (x^2 + 3x − 4) and g (x) = (x+4) find f/g and state the domain.
Answers: 1

Mathematics, 22.06.2019 00:30
Me i’m stuck on all these questions besides the two bottom ones
Answers: 2

Mathematics, 22.06.2019 03:30
The slope of the line passing through the points (2, 7) and (-4, 8) is
Answers: 2

Mathematics, 22.06.2019 03:30
Would love some on this! include step by step have a good day!
Answers: 1
You know the right answer?
During a snowstorm, Taylor tracked the amount of snow on the ground. When the storm began, there wer...
Questions

Mathematics, 14.05.2021 22:30


Mathematics, 14.05.2021 22:30


English, 14.05.2021 22:30


English, 14.05.2021 22:30

Mathematics, 14.05.2021 22:30


Mathematics, 14.05.2021 22:30


Social Studies, 14.05.2021 22:30

History, 14.05.2021 22:30

Mathematics, 14.05.2021 22:30


