Mathematics, 25.08.2021 23:20 rk193140
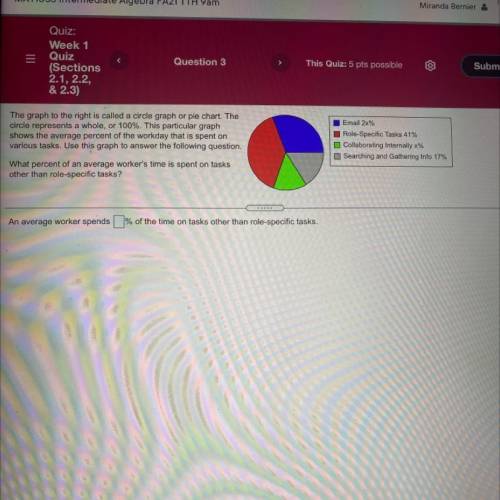
The graph to the right is called a circle graph or pie chart. The
circle represents a whole, or 100%. This particular graph
shows the average percent of the workday that is spent on
various tasks. Use this graph to answer the following question.
Email 2x%
Role-Specific Tasks 41%
Collaborating Internally x%
Searching and Gathering Info 17%
What percent of an average worker's time is spent on tasks
other than role-specific tasks?
TITIE


Answers: 3


Another question on Mathematics

Mathematics, 21.06.2019 17:00
You are on a cycling trip around europe with friends. you check the weather forecast for the first week. these are the temperatures for the week. sun mon tues wed thurs fri sat 16°c 20°c 24°c 28°c 28°c 23°c 15°c what is the mean temperature forecast for the week?
Answers: 1


Mathematics, 21.06.2019 21:30
Joanie wrote a letter that was 1 1/4 pages long. katie wrote a letter that was 3/4 page shorter then joagies letter. how long was katies letter
Answers: 1

You know the right answer?
The graph to the right is called a circle graph or pie chart. The
circle represents a whole, or 10...
Questions


Mathematics, 22.10.2019 23:00

Business, 22.10.2019 23:00


Mathematics, 22.10.2019 23:00


Mathematics, 22.10.2019 23:00


Mathematics, 22.10.2019 23:00

English, 22.10.2019 23:00

History, 22.10.2019 23:00


Mathematics, 22.10.2019 23:00


Mathematics, 22.10.2019 23:00

Mathematics, 22.10.2019 23:00

Mathematics, 22.10.2019 23:00


