
Mathematics, 27.08.2021 20:50 Lewis5442
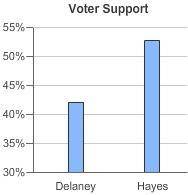
PLEASE HELP!!! Why is this graph misleading?
A. The sum of the percents for the candidates does not equal 100%.
B. The vertical axis does not begin at 0%.
C. The vertical axis does not end at 100%.

Answers: 1


Another question on Mathematics
Mathematics, 21.06.2019 21:00
Which line is parallel to the line that passes through the points (2, –5) and (–4, 1) a. y=-x+5 b. y=-2/3x+3 c. y=2/3x-2 d. y=x+5
Answers: 2
Mathematics, 21.06.2019 21:00
Ariana starts with 100 milligrams of a radioactive substance. the amount of the substance decreases by 20% each week for a number of weeks, w. the expression 100(1−0.2)w finds the amount of radioactive substance remaining after w weeks. which statement about this expression is true? a) it is the difference between the initial amount and the percent decrease. b) it is the difference between the initial amount and the decay factor after w weeks. c) it is the initial amount raised to the decay factor after w weeks. d) it is the product of the initial amount and the decay factor after w weeks.
Answers: 1
Mathematics, 22.06.2019 01:30
What is 0.368,0.380,0.365,and 0.383 in order from least to greatest
Answers: 1
You know the right answer?
PLEASE HELP!!! Why is this graph misleading?
A. The sum of the percents for the candidates does no...
Questions
Mathematics, 12.10.2019 08:30

Arts, 12.10.2019 08:30

Chemistry, 12.10.2019 08:30

English, 12.10.2019 08:30

Geography, 12.10.2019 08:30

History, 12.10.2019 08:30

English, 12.10.2019 08:30

Mathematics, 12.10.2019 08:30
Mathematics, 12.10.2019 08:30
Chemistry, 12.10.2019 08:30


