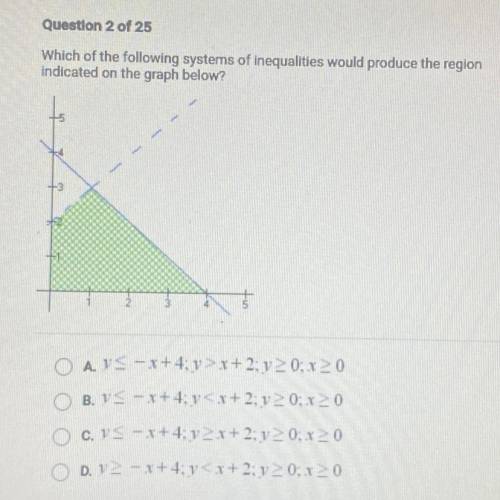
HELP PLS
Which of the following systems of inequalities would produce the region
indicated o...

Mathematics, 02.09.2021 05:50 allison9746
HELP PLS
Which of the following systems of inequalities would produce the region
indicated on the graph below?


Answers: 2


Another question on Mathematics

Mathematics, 21.06.2019 21:00
Isabel graphed the following system of equations. 2x – y = 6 y = -3x + 4 she came up with the solution (2,-2). what were the 3 steps she did to get that solution? (make sure they are in the correct order)
Answers: 2

Mathematics, 21.06.2019 22:00
(05.02)a farmer has decided to divide his land area in half in order to plant soy and corn. calculate the area of the entire area so he knows how much soil is needed. a parallelogram with a height of 6 yards and side length 9 yards. the height forms a triangle with the slanted side of the rhombus with a base of 2.5 yards. rhombus is split into a soy half and a corn half. each bag of soil covers 40 square yards. how many bags should the farmer purchase?
Answers: 3

Mathematics, 22.06.2019 00:50
The students in a class were asked how many siblings they have. the data obtained is represented in the dot plot. the number of students who have no siblings is . the number of students who have three or more siblings is .
Answers: 1

Mathematics, 22.06.2019 02:30
Atrain traveled for 1.5 hours to the first station, stopped for 30 minutes, then traveled for 4 hours to the final station where it stopped for 1 hour. the total distance traveled is a function of time. which graph most accurately represents this scenario? a graph is shown with the x-axis labeled time (in hours) and the y-axis labeled total distance (in miles). the line begins at the origin and moves upward for 1.5 hours. the line then continues upward at a slow rate until 2 hours. from 2 to 6 hours, the line continues quickly upward. from 6 to 7 hours, it moves downward until it touches the x-axis a graph is shown with the axis labeled time (in hours) and the y axis labeled total distance (in miles). a line is shown beginning at the origin. the line moves upward until 1.5 hours, then is a horizontal line until 2 hours. the line moves quickly upward again until 6 hours, and then is horizontal until 7 hours a graph is shown with the axis labeled time (in hours) and the y-axis labeled total distance (in miles). the line begins at the y-axis where y equals 125. it is horizontal until 1.5 hours, then moves downward until 2 hours where it touches the x-axis. the line moves upward until 6 hours and then moves downward until 7 hours where it touches the x-axis a graph is shown with the axis labeled time (in hours) and the y-axis labeled total distance (in miles). the line begins at y equals 125 and is horizontal for 1.5 hours. the line moves downward until 2 hours, then back up until 5.5 hours. the line is horizontal from 5.5 to 7 hours
Answers: 1
You know the right answer?
Questions

English, 13.10.2020 20:01

Mathematics, 13.10.2020 20:01


Mathematics, 13.10.2020 20:01


Biology, 13.10.2020 20:01


Mathematics, 13.10.2020 20:01

Mathematics, 13.10.2020 20:01

Mathematics, 13.10.2020 20:01


Mathematics, 13.10.2020 20:01

Social Studies, 13.10.2020 20:01

English, 13.10.2020 20:01

Mathematics, 13.10.2020 20:01

Social Studies, 13.10.2020 20:01


Mathematics, 13.10.2020 20:01


