Mathematics, 02.09.2021 23:20 kkkikibdh
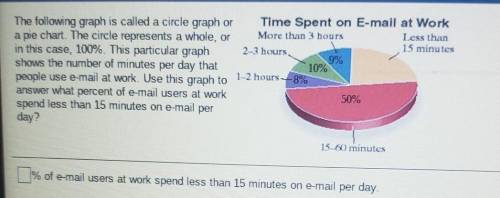
The following graph is called a circle graph or a pie chart. The circle represents a whole, or in this case, 100%. This particular graph shows the number of minutes per day that people use e-mail at work. Use this graph to answer what percent of e-mail users at work spend less than 15 minutes on e-mail per day? Time Spent on E-mail at Work More than 5 hours Less than 15 minutes 2:13 hours 9% 10% 1-2 hours -8% 50%


Answers: 2


Another question on Mathematics

Mathematics, 20.06.2019 18:02
What is the area of the triangle on the flag of the philippines in inches
Answers: 2

Mathematics, 21.06.2019 15:30
Given the box plot, will the mean or the median provide a better description of the center? box plot with min at 10.5, q1 at 11.5, median at 12.5, q3 at 13.5, max at 15
Answers: 2

Mathematics, 21.06.2019 18:30
Players on the school soccer team are selling candles to raise money for an upcoming trip. each player has 24 candles to sell. if a player sells 4 candles a profit of$30 is made. if he sells 12 candles a profit of $70 is made. determine an equation to model his situation?
Answers: 3

Mathematics, 21.06.2019 21:00
What is the missing statement in step 4? ? rts ? ? vtu and ? rtu ? ? vts ? rts ? ? rvs and ? rtu ? ? stv ? vrs ? ? vru and ? usr ? ? usv ? vur ? ? vus and ? uvs ? ? sru
Answers: 3
You know the right answer?
The following graph is called a circle graph or a pie chart. The circle represents a whole, or in th...
Questions

History, 15.01.2020 15:31


Biology, 15.01.2020 15:31


Mathematics, 15.01.2020 15:31


Geography, 15.01.2020 15:31


English, 15.01.2020 15:31

Mathematics, 15.01.2020 15:31


Health, 15.01.2020 15:31

Mathematics, 15.01.2020 15:31


Biology, 15.01.2020 15:31


