
Mathematics, 07.09.2021 21:40 sandygarcia65
If you spam answer, I will report you.
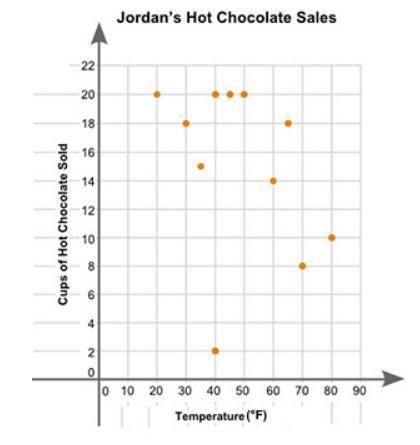
Jordan plotted the graph below to show the relationship between the temperature of his city and the number of cups of hot chocolate he sold daily:
Part A: In your own words, describe the relationship between the temperature of the city and the number of cups of hot chocolate sold.
Part B: Describe how you can make the line of best fit. Write the approximate slope and y-intercept of the line of best fit. Show your work, including the points that you use to calculate the slope and y-intercept.

Answers: 1


Another question on Mathematics
Mathematics, 21.06.2019 23:30
Asap (i need to finish this quick) graph complete the sequence of transformations that produces △x'y'z' from △xyz. a clockwise rotation ° about the origin followed by a translation units to the right and 6 units down produces δx'y'z' from δxyz.
Answers: 1
Mathematics, 21.06.2019 23:30
Adele is five years older than timothy. in three years, timothy will be 2/3 of adele’s age. what is adele‘s current age?
Answers: 1
Mathematics, 22.06.2019 01:00
Find the center of the circle that can be circumscribed about efg with e(4,4) f(4,2) g(8,2)
Answers: 1
You know the right answer?
If you spam answer, I will report you.
Jordan plotted the graph below to show the relationship bet...
Questions

Social Studies, 29.10.2019 23:31


English, 29.10.2019 23:31
Mathematics, 29.10.2019 23:31
Mathematics, 29.10.2019 23:31

Mathematics, 29.10.2019 23:31
Mathematics, 29.10.2019 23:31
Social Studies, 29.10.2019 23:31

Chemistry, 29.10.2019 23:31
Mathematics, 29.10.2019 23:31

Advanced Placement (AP), 29.10.2019 23:31
Mathematics, 29.10.2019 23:31
English, 29.10.2019 23:31

Biology, 29.10.2019 23:31


