
Mathematics, 08.09.2021 18:10 andy2461
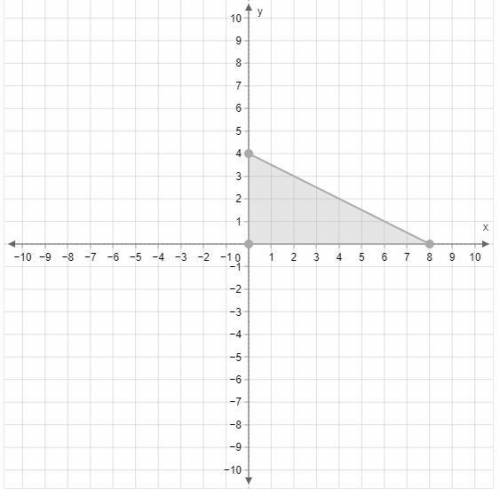
Graph the image of the given triangle under a dilation with a scale factor of 14 and center of dilation (0, 0) . To graph the triangle, select the "Polygon" tool and draw the triangle by plotting each vertex in order until it lands back on the first vertex. Do not retrace any sides. You may use the "Move" tool to move your image if needed.

Answers: 2


Another question on Mathematics
Mathematics, 20.06.2019 18:04
Achel bought 12 rolls of packing tape and paid a total of $33.60. kevin also bought rolls of packing tape. the table shows the total amount he is paid for different numbers of packing tape. number of rolls of packing tape total amount paid 2 $6.40 5 $16.00 8 $25.60 how do the unit rates compare? select from the drop-down menus to correctly complete the statement. rachel's unit rate is than kevin's because is greater than .
Answers: 3
Mathematics, 21.06.2019 21:00
Awater tank holds 18000 gallons. how long will it take for the water level to reach 6000 gallons if the water is used at anaverage rate of 450 gallons per day
Answers: 1
Mathematics, 21.06.2019 22:00
The median am of triangle ∆abc is half the length of the side towards which it is drawn, bc . prove that triangle ∆abc is a right triangle, and find angle mac and abm
Answers: 1
Mathematics, 21.06.2019 22:00
After a dreary day of rain, the sun peeks through the clouds and a rainbow forms. you notice the rainbow is the shape of a parabola. the equation for this parabola is y = -x2 + 36. graph of a parabola opening down at the vertex 0 comma 36 crossing the x–axis at negative 6 comma 0 and 6 comma 0. in the distance, an airplane is taking off. as it ascends during take-off, it makes a slanted line that cuts through the rainbow at two points. create a table of at least four values for the function that includes two points of intersection between the airplane and the rainbow. analyze the two functions. answer the following reflection questions in complete sentences. what is the domain and range of the rainbow? explain what the domain and range represent. do all of the values make sense in this situation? why or why not? what are the x- and y-intercepts of the rainbow? explain what each intercept represents. is the linear function you created with your table positive or negative? explain. what are the solutions or solution to the system of equations created? explain what it or they represent. create your own piecewise function with at least two functions. explain, using complete sentences, the steps for graphing the function. graph the function by hand or using a graphing software of your choice (remember to submit the graph).
Answers: 2
You know the right answer?
Graph the image of the given triangle under a dilation with a scale factor of 14 and center of dilat...
Questions

Biology, 17.03.2022 02:00
Mathematics, 17.03.2022 02:00

Social Studies, 17.03.2022 02:00
Mathematics, 17.03.2022 02:00


Computers and Technology, 17.03.2022 02:00
Mathematics, 17.03.2022 02:00
Computers and Technology, 17.03.2022 02:00

Social Studies, 17.03.2022 02:10

Mathematics, 17.03.2022 02:10

Mathematics, 17.03.2022 02:10


