
Mathematics, 09.09.2021 23:00 marifermolina
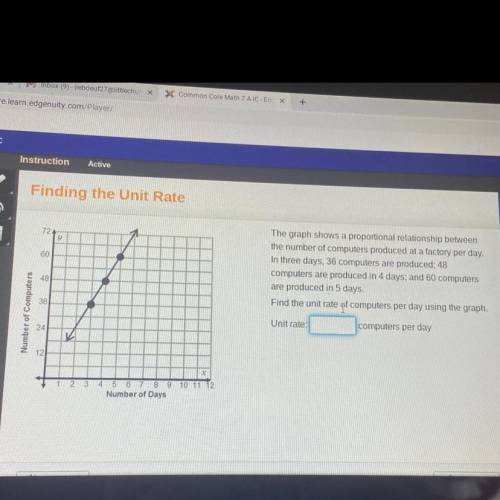
The graph shows a proportional relationship between
the number of computers produced at a factory per day.
In three days, 36 computers are produced: 48
computers are produced in 4 days; and 60 computers
are produced in 5 days.
Find the unit rate of computers per day using the graph.
48
36
Number of Computers
Unit rate:
computers per day
24
12
X
1 2 3 4 5 6 7 8 9 10 11 12
Number of Days

Answers: 3


Another question on Mathematics
Mathematics, 21.06.2019 17:00
(! ) three cylinders have a height of 8 cm. cylinder 1 has a radius of 1 cm. cylinder 2 has a radius of 2 cm. cylinder 3 has a radius of 3 cm. find the volume of each cylinder
Answers: 1
Mathematics, 21.06.2019 17:30
Kathy spent 5/8 of her money on books and another 1/6 of her money on stationeries.what fraction of kathy’s money was left?
Answers: 2
Mathematics, 21.06.2019 20:40
Formulate the indicated conclusion in nontechnical terms. be sure to address the original claim. the foundation chair for a hospital claims that the mean number of filled overnight beds is over 523, and she is therefore justified starting a funding campaign to add a wing to the hospital. assuming that a hypothesis test has been conducted and that the conclusion is failure to reject the null hypothesis, state the conclusion in nontechnical terms.
Answers: 3
You know the right answer?
The graph shows a proportional relationship between
the number of computers produced at a factory...
Questions

Computers and Technology, 19.11.2019 18:31
Mathematics, 19.11.2019 18:31

Mathematics, 19.11.2019 18:31


Computers and Technology, 19.11.2019 18:31

Computers and Technology, 19.11.2019 18:31
Mathematics, 19.11.2019 18:31
Computers and Technology, 19.11.2019 18:31


