x≥−3

Mathematics, 11.09.2021 03:10 robertss403
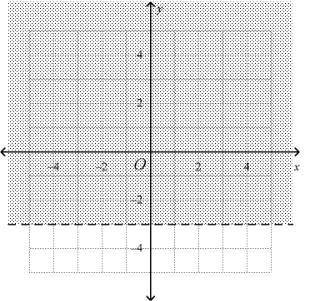
Give the linear inequality shown in the graph below.
Group of answer choices
x≥−3
y>−3
y≥−3
x>−3

Answers: 2


Another question on Mathematics
Mathematics, 21.06.2019 21:00
Check all that apply. f is a function. f is a one-to-one function. c is a function. c is a one-to-one function.
Answers: 3
Mathematics, 21.06.2019 23:00
Complete the conditional statement. if a + 2 < b + 3, then a < b b < a a – b < 1 a < b + 1
Answers: 3
Mathematics, 21.06.2019 23:00
If a company produces x units of an item at a cost of $35 apiece the function c=35x is a of the total production costs
Answers: 2
You know the right answer?
Give the linear inequality shown in the graph below.
Group of answer choices
x≥−3
x≥−3
Questions


Business, 16.10.2019 02:10


