
Mathematics, 13.09.2021 03:00 jazzwok
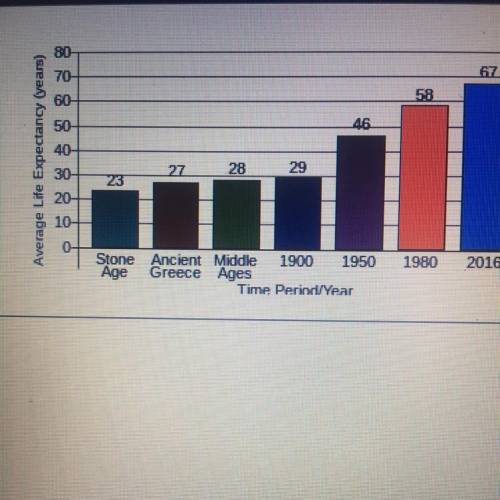
The bar graph shows that life expectancy, the number of years newbors are expected to live, in a particular region has increased dramatically since ancient
times. Find the percent increase in average life expectancy of the region from the Stone Age to 2016.
Average Life Expectancy tyears)
30
(Round to the nearest integer as needed.)

Answers: 2


Another question on Mathematics
Mathematics, 21.06.2019 14:10
Element x decays radioactively with a half life of 8 minutes. if there are 450 grams of element x, how long, to the nearest tenth of a minute, would it take the element to decay to 37 grams?
Answers: 2
Mathematics, 21.06.2019 19:00
Solve 3x-18=2y and 5x-6y=14 by elimination or substitution . show all !
Answers: 1
Mathematics, 21.06.2019 21:20
If two angles of a triangle have equal measures and the third angle measures 90°, what are the angle measures of the triangle? a. 60°, 60°, 60° b. 45°, 90°, 90° c. 30°, 30°, 90° d. 45°, 45°, 90°
Answers: 2
You know the right answer?
The bar graph shows that life expectancy, the number of years newbors are expected to live, in a par...
Questions

History, 14.11.2019 03:31
Mathematics, 14.11.2019 03:31
Mathematics, 14.11.2019 03:31


Social Studies, 14.11.2019 03:31

Mathematics, 14.11.2019 03:31
Mathematics, 14.11.2019 03:31

Mathematics, 14.11.2019 03:31
Social Studies, 14.11.2019 03:31


