
Mathematics, 24.09.2021 09:50 Olaf2018
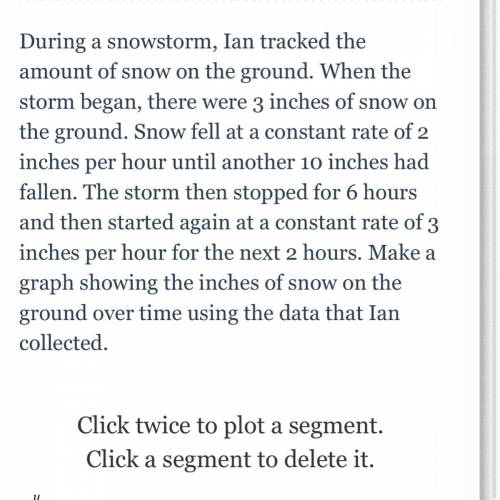
During a snowstorm, Ian tracked the amount of snow on the ground. When the storm began, there were 3 inches of snow on the ground. Snow fell at a constant rate of 2 inches per hour until another 10 inches had fallen. The storm then stopped for 6 hours and then started again at a constant rate of 3 inches per hour for the next 2 hours. Make a graph showing the inches of snow on the ground over time using the data that Ian collected.

Answers: 3


Another question on Mathematics
Mathematics, 21.06.2019 19:30
Which of the following is the explicit rule for a geometric sequence defined a recursive formula of a -5a for which the first term is 23?
Answers: 1
Mathematics, 21.06.2019 19:30
Find the commission on a $590.00 sale if the commission is 15%.
Answers: 2
Mathematics, 21.06.2019 22:10
Which of the following circles have their centers in the third quadrant?
Answers: 2
You know the right answer?
During a snowstorm, Ian tracked the amount of snow on the ground. When the storm began, there were 3...
Questions
Mathematics, 18.10.2019 08:30

Social Studies, 18.10.2019 08:30
Mathematics, 18.10.2019 08:30

Chemistry, 18.10.2019 08:30
Mathematics, 18.10.2019 08:30

English, 18.10.2019 08:30


Spanish, 18.10.2019 08:30
History, 18.10.2019 08:30
English, 18.10.2019 08:30

Health, 18.10.2019 08:30


