
Mathematics, 27.09.2021 14:00 awkwardness92
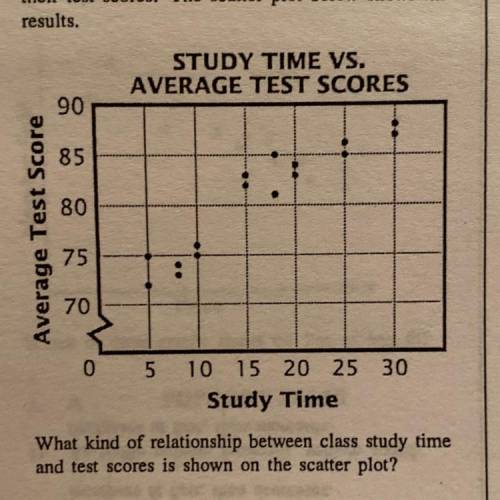
Mr. Thomas wanted to know if the amount of
class time that he gave students to study affected
their test scores. The scatter plot below shows the
results,
STUDY TIME VS.
AVERAGE TEST SCORES
90
85
80
Average Test Score
75
:
70
0 5 10 15 20 25 30
Study Time
What kind of relationship between class study time
and test scores is shown on the scatter plot?
A. no correlation
B. positive correlation
C. negative correlation
D. positive then negative correlation

Answers: 3


Another question on Mathematics
Mathematics, 21.06.2019 18:00
The given dot plot represents the average daily temperatures, in degrees fahrenheit, recorded in a town during the first 15 days of september. if the dot plot is converted to a box plot, the first quartile would be drawn at __ , and the third quartile would be drawn at __ link to graph: .
Answers: 1
Mathematics, 21.06.2019 20:00
Parabolas y=−2x^2 and y=2x^2 +k intersect at points a and b that are in the third and the fourth quadrants respectively. find k if length of the segment ab is 5.
Answers: 1
Mathematics, 21.06.2019 21:40
Which of the following best describes the graph below? + + 2 + 3 + 4 1 o a. it is not a function. o b. it is a one-to-one function. o c. it is a many-to-one function. o d. it is a function, but it is not one-to-one.
Answers: 3
Mathematics, 21.06.2019 22:50
What is the ordered pair of m’ after point m (5, 6) is rotated 90° counterclockwise?
Answers: 2
You know the right answer?
Mr. Thomas wanted to know if the amount of
class time that he gave students to study affected
Questions


Mathematics, 16.07.2021 17:10

Mathematics, 16.07.2021 17:10
Mathematics, 16.07.2021 17:10
Mathematics, 16.07.2021 17:10
Mathematics, 16.07.2021 17:20
Business, 16.07.2021 17:20
Mathematics, 16.07.2021 17:20
English, 16.07.2021 17:20

Spanish, 16.07.2021 17:20


