
Mathematics, 29.09.2021 16:40 akai971
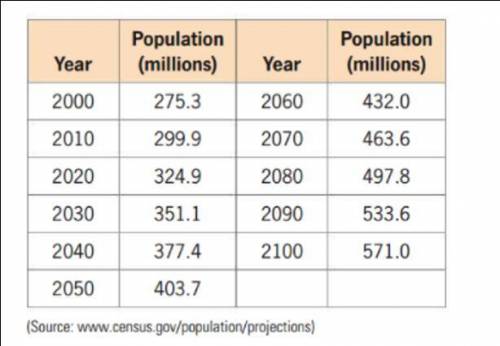
The following table gives projections of the U. S. population from 2000 to 2100.
a) Find a linear function that models the data (the equation of best fit) with x equal to the number of years after 2000 and f(x) equal to the population in millions.
Find f(65) and state what it means.
Find the slope of the line. What does it mean in the context of the problem?

Answers: 1


Another question on Mathematics
Mathematics, 21.06.2019 15:30
The weight of an object in a particular scale is 175.2 lbs. the measured weight may vary from the actual weight by at most 0.1 lbs. what is the range of actual weights of the object
Answers: 3
Mathematics, 21.06.2019 18:00
What is the location of point g, which partitions the directed line segment from d to f into a 5: 4 ratio? –1 0 2 3
Answers: 1
Mathematics, 21.06.2019 19:20
Which of the following quartic functions has x = –1 and x = –2 as its only two real zeroes?
Answers: 1
You know the right answer?
The following table gives projections of the U. S. population from 2000 to 2100.
a) Find a linear...
Questions
Mathematics, 21.02.2020 02:54

Biology, 21.02.2020 02:54
Mathematics, 21.02.2020 02:54

History, 21.02.2020 02:55
Mathematics, 21.02.2020 02:55
History, 21.02.2020 02:55


Mathematics, 21.02.2020 02:55


