
Mathematics, 30.09.2021 01:00 NotYourStudent
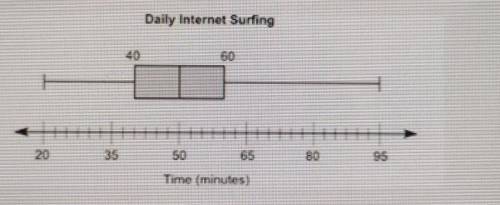
I HAVE 5 MINUTES LEFT PLEASE GIVE ME THE ANSWER RIGHT! I NEED IT! The box plot below shows the total amount of time, in minutes, the students of a class surf the Internet every day:
Part A: List two pieces of information that are provided by the graph and one piece of information that is not provided by the graph.
Part B: Calculate the interquartile range of the data, and explain in a sentence or two what it represents.
Part C: Explain what affect, if any, there will be if an outlier is present.

Answers: 1


Another question on Mathematics
Mathematics, 20.06.2019 18:04
Atriangle has sides with lengths of 10 yards, 13 yards, and 18 yards. is it a right triangle?
Answers: 1
Mathematics, 21.06.2019 14:00
If x = 12 and y = 3, what is the value of x - y 2? 81 6 3 18
Answers: 1
Mathematics, 21.06.2019 23:00
What ia the sum if the first 7 terms of the geometric series
Answers: 2
You know the right answer?
I HAVE 5 MINUTES LEFT PLEASE GIVE ME THE ANSWER RIGHT! I NEED IT! The box plot below shows the total...
Questions

English, 06.05.2020 00:01
English, 06.05.2020 00:01
Mathematics, 06.05.2020 00:01
English, 06.05.2020 00:01


Computers and Technology, 06.05.2020 00:01

History, 06.05.2020 00:01
History, 06.05.2020 00:01
English, 06.05.2020 00:01

Mathematics, 06.05.2020 00:01
Mathematics, 06.05.2020 00:01
Mathematics, 06.05.2020 00:01
Computers and Technology, 06.05.2020 00:01
English, 06.05.2020 00:01


