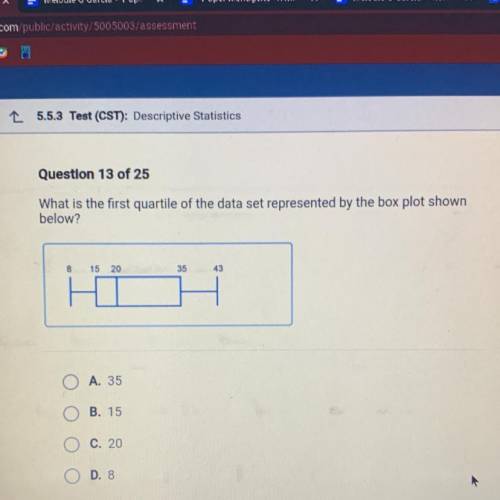
What is the first quartile of the data set represented by the box plot shown
below?
8
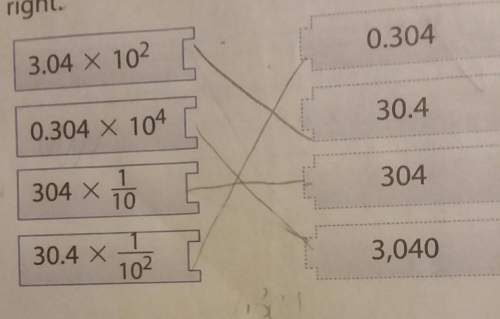
...

Mathematics, 03.10.2021 14:00 dondre54
What is the first quartile of the data set represented by the box plot shown
below?
8
15 20
35
43
A. 35
B. 15
C. 20
O
D. 8

Answers: 1


Another question on Mathematics
Mathematics, 20.06.2019 18:04
Complete the square to determine the minimum or maximum value of the function defined by the expression. x2 − 12x − 2 a) maximum value at 38 b) minimum value at 38 c) maximum value at −38 d) minimum value at −38
Answers: 3
Mathematics, 21.06.2019 20:00
Formulate alisha has a number in mind. if she adds three to her number the result is less than five. use this information to write and solve an inequality about alisha's number. then graph the solution set.
Answers: 1
Mathematics, 21.06.2019 23:30
Sally deposited money into a savings account paying 4% simple interest per year.the first year,she earn $75 in interest.how much interest will she earn during the following year?
Answers: 1
You know the right answer?
Questions

Mathematics, 15.10.2019 20:10


Computers and Technology, 15.10.2019 20:10


