
Mathematics, 03.10.2021 14:00 edirsonperez3073
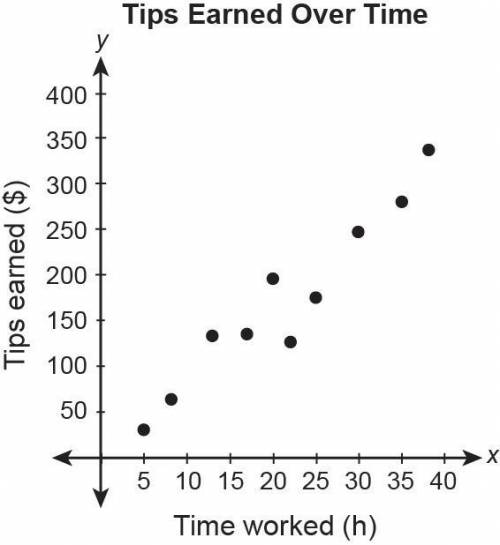
This scatter plot shows the amount of tips earned and hours worked. Choose the statement that is best supported by the data in the scatter plot. Question 10 options: The data shows a non-linear association between the number of hours worked and tips earned.
The data shows no apparent association between the number of hours worked and tips earned.
The data shows a positive linear association between the number of hours worked and tips earned.
The data shows a negative linear association between the number of hours worked and tips earned.

Answers: 1


Another question on Mathematics
Mathematics, 21.06.2019 20:30
If you are dealt 4 cards from a shuffled deck of 52? cards, find the probability that all 4 cards are diamondsdiamonds.
Answers: 1
Mathematics, 21.06.2019 21:10
What is the equation of a line passing through (-6,5) and having a slope of 1/3
Answers: 3
Mathematics, 21.06.2019 22:30
What fraction is equivalent to 0.46464646··· a. 46⁄999 b. 46⁄100 c. 46⁄99 d. 23⁄50
Answers: 1
Mathematics, 21.06.2019 23:00
Mrs.sling bought a pound of green beans for $1.80. how much will mrs.tennison pay for 3 1/2 pounds of green beans?
Answers: 1
You know the right answer?
This scatter plot shows the amount of tips earned and hours worked. Choose the statement that is bes...
Questions


Mathematics, 26.03.2020 16:17

Mathematics, 26.03.2020 16:17
Mathematics, 26.03.2020 16:17

History, 26.03.2020 16:17

Computers and Technology, 26.03.2020 16:17


