
Mathematics, 05.10.2021 14:00 honey66
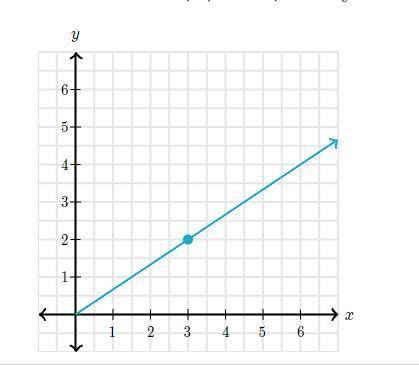
The following graph shows a proportional relationship. What is the constant of proportionality between y and x in the graph?

Answers: 1


Another question on Mathematics
Mathematics, 21.06.2019 17:20
Read the situations in the table below. then drag a graph and equation to represent each situation. indicate whether each of the relationships is proportional or non-proportional. edit : i got the right answer its attached
Answers: 2
Mathematics, 21.06.2019 18:00
Which represents the solution set of the inequality 5x-9 < 21? a. x < 12/5 b. x > 12/5 c. x > 6 d. x < 6
Answers: 2
Mathematics, 21.06.2019 23:00
Bobs burgers bam has a special deal of 4 hamburgers for $6. at that rate, how much should it cost to buy 3 hamburgers?
Answers: 1
Mathematics, 21.06.2019 23:40
The function f(x) is shown in this graph the function g(x)=6x
Answers: 2
You know the right answer?
The following graph shows a proportional relationship.
What is the constant of proportionality bet...
Questions
Mathematics, 07.01.2021 17:30

Physics, 07.01.2021 17:30
Mathematics, 07.01.2021 17:30

Mathematics, 07.01.2021 17:30

English, 07.01.2021 17:30
Mathematics, 07.01.2021 17:30

Biology, 07.01.2021 17:30


Computers and Technology, 07.01.2021 17:30


History, 07.01.2021 17:30


