
Mathematics, 05.10.2021 15:00 alinegonzalez0027
Question 4 of 10
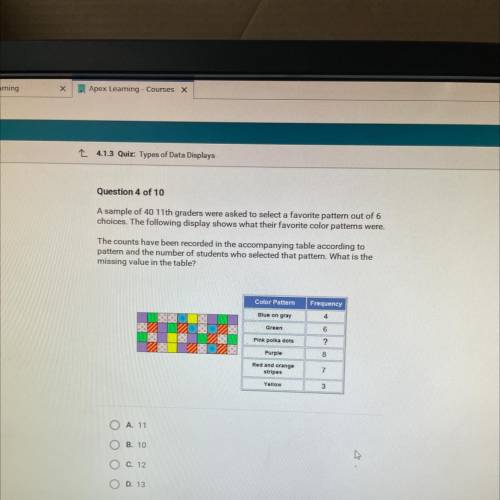
A sample of 40 11th graders were asked to select a favorite pattern out of 6
choices. The following display shows what their favorite color patterns were.
The counts have been recorded in the accompanying table according to
pattern and the number of students who selected that pattern. What is the
missing value in the table?
Color Pattern
Frequency
Blue on gray
4
Green
6
Pink polka dots
?
Purple
8
Red and orange
stripes
7
Yellow
3
O A. 11
OB. 10
O C. 12
OD. 13

Answers: 3


Another question on Mathematics
Mathematics, 21.06.2019 18:30
How do you create a data set with 8 points in it that has a mean of approximately 10 and a standard deviation of approximately 1?
Answers: 1
Mathematics, 21.06.2019 21:30
How does reflecting or rotating a figure change the interior angles of the figure?
Answers: 2
Mathematics, 21.06.2019 23:00
How many heads would you expect if you flipped a coin twice? first, fill in the table below with the correct probabilities. hint: the sample space for flipping a coin twice is {hh, ht, th, tt}. a = b = c =
Answers: 3
Mathematics, 22.06.2019 01:00
Find all the angles that satisfy the equation cos(θ)=32
Answers: 2
You know the right answer?
Question 4 of 10
A sample of 40 11th graders were asked to select a favorite pattern out of 6
Questions

Biology, 14.12.2020 20:50

Engineering, 14.12.2020 20:50

English, 14.12.2020 20:50

History, 14.12.2020 20:50
Biology, 14.12.2020 20:50

Mathematics, 14.12.2020 20:50
Mathematics, 14.12.2020 20:50

English, 14.12.2020 20:50

Health, 14.12.2020 20:50


