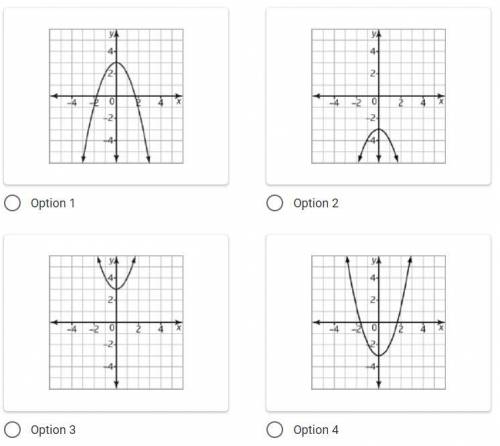
Which one of the following graphs best represents the equation shown?
y = -x^2 + 3
...

Mathematics, 10.10.2021 21:00 briannabo08
Which one of the following graphs best represents the equation shown?
y = -x^2 + 3

Answers: 1


Another question on Mathematics
Mathematics, 21.06.2019 23:00
Evaluate the function , when d = {9, 15, 30}. r = {5, 7, 12} r = {6, 10, 15} r = {6, 10, 20} r = {5, 12, 20}
Answers: 2
Mathematics, 22.06.2019 00:00
28 x 12 + 34 = ? it's for a test that if i fail on i will not proceed into the honor roll society i always dreamed of!me! worth 50 !
Answers: 1
Mathematics, 22.06.2019 00:30
Javier bought a painting for $150. each year, the painting's value increases by a factor of 1.15. which expression gives the painting's value after 77 years?
Answers: 2
Mathematics, 22.06.2019 02:20
Combine like terms to create an equivalent expression. make sure to simplify coefficients and constants as well. -6/5-2/3v+4/15+1/3v
Answers: 2
You know the right answer?
Questions

Computers and Technology, 16.11.2020 21:00

History, 16.11.2020 21:00

Chemistry, 16.11.2020 21:00

Biology, 16.11.2020 21:00

English, 16.11.2020 21:00
Mathematics, 16.11.2020 21:00
Mathematics, 16.11.2020 21:00
Mathematics, 16.11.2020 21:00
Mathematics, 16.11.2020 21:00
History, 16.11.2020 21:00
Mathematics, 16.11.2020 21:00

Health, 16.11.2020 21:00
Mathematics, 16.11.2020 21:00

Law, 16.11.2020 21:00
Chemistry, 16.11.2020 21:00
Mathematics, 16.11.2020 21:00


