
Mathematics, 13.10.2021 01:50 mmaglaya1
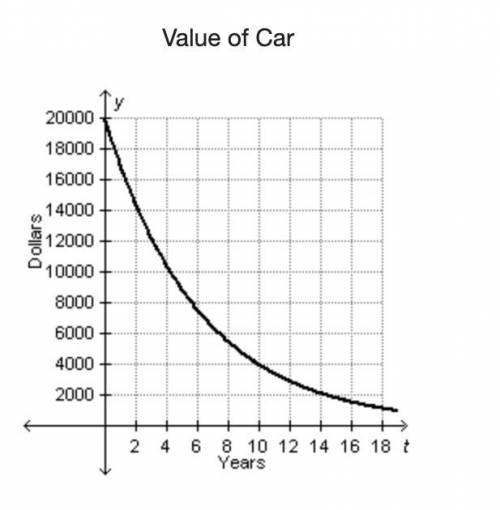
The graph below models the value of a $20,000 car t years after it was purchased.
Value of Car
A graph titled Value of Car has years on the x-axis and Dollars on the y-axis. A line curves down and goes through points (0, 20,000), (4, 10,000), and (14, 2,000).
Which statement best describes why the value of the car is a function of the number of years since it was purchased?
Each car value, y, is associated with exactly one time, t.
Each time, t, is associated with exactly one car value, y.
The rate at which the car decreases in value is not constant.
There is no time, t, at which the value of the car is 0.

Answers: 3


Another question on Mathematics
Mathematics, 21.06.2019 12:30
Trevor and marissa together have 26 t-shirts to sell. if marissa has 6 fewer tshirts that trevor, find hiw many tshirts trevor has. identify the if-than moves in your solution
Answers: 1
Mathematics, 21.06.2019 13:20
Suppose that x and y are both differentiable functions of t and are related by the given equation. use implicit differentiation with respect to t to determine startfraction dy over dt endfraction in terms of x, y, and startfraction dx over dt endfraction .
Answers: 3
Mathematics, 21.06.2019 22:00
Two numbers have a sum of -19. one number is x. what expression represents the other number?
Answers: 2
You know the right answer?
The graph below models the value of a $20,000 car t years after it was purchased.
Value of Car
Questions

Medicine, 15.03.2022 15:10

Mathematics, 15.03.2022 15:20

Social Studies, 15.03.2022 15:20
Mathematics, 15.03.2022 15:20
Mathematics, 15.03.2022 15:20
Mathematics, 15.03.2022 15:20
Mathematics, 15.03.2022 15:20

Mathematics, 15.03.2022 15:20
Mathematics, 15.03.2022 15:20
Mathematics, 15.03.2022 15:20
Mathematics, 15.03.2022 15:20
Mathematics, 15.03.2022 15:20


