
Mathematics, 18.10.2021 09:10 tytianadyson74
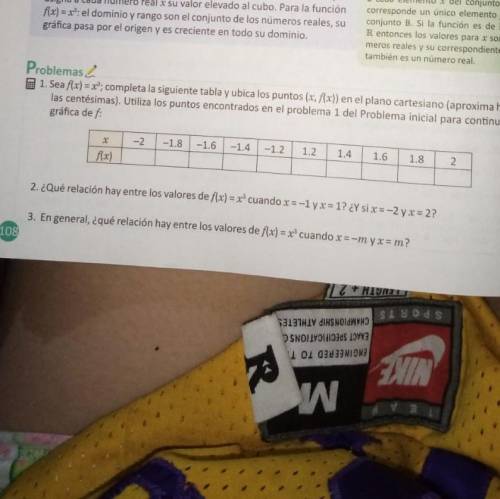
gráfica pasa por Problemas E1. Sea fx) =x; completa la siguiente tabla y ubica los puntos (x, flx)) en el plano cartesiano (aproxima hasta las centésimas). Utiliza los puntos encontrados en el problema 1 del Problema inicial para continuar la gráfica de f: -2 -1.8 -1.6 -1.4 -1.2 1.2 flx) 1.4 1.6 1.8 2

Answers: 1


Another question on Mathematics
Mathematics, 21.06.2019 18:00
Which shows the correct lengths of side c in both scales? scale 1: 45 m; scale 2: 60 m scale 1: 60 m; scale 2: 45 m scale 1: 36 m; scale 2: 27 m scale 1: 27 m; scale 2: 36 m mark this and return save and exit
Answers: 3
Mathematics, 21.06.2019 19:00
Identify the type of observational study described. a statistical analyst obtains data about ankle injuries by examining a hospital's records from the past 3 years. cross-sectional retrospective prospective
Answers: 2
Mathematics, 21.06.2019 20:00
Use the elimination method to solve the systems of equations.choose the correct ordered pair. 7x+4y=39
Answers: 1
Mathematics, 21.06.2019 21:30
One astronomical unit (1 au) is about 1.496 alt tag missing. kilometers. if you wrote this number of kilometers in regular decimal notation (for example, 528 and 3,459 are written in regular decimal notation), how many zeros would your number have?
Answers: 1
You know the right answer?
gráfica pasa por Problemas E1. Sea fx) =x; completa la siguiente tabla y ubica los puntos (x, flx))...
Questions

History, 17.07.2019 10:50


Chemistry, 17.07.2019 10:50
Mathematics, 17.07.2019 10:50

Mathematics, 17.07.2019 10:50


