
Mathematics, 19.10.2021 02:20 brittanyfox411
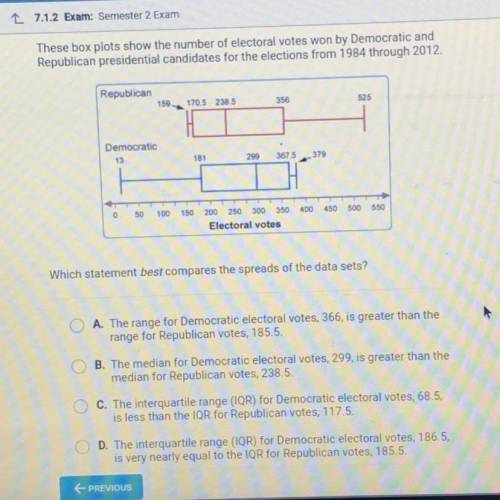
These box plots show the number of electoral votes won by Democratic and
Republican presidential candidates for the elections from 1984 through 2012.
Which statement best compares the spreads of the data sets? A

Answers: 1


Another question on Mathematics
Mathematics, 21.06.2019 20:20
Recall that the owner of a local health food store recently started a new ad campaign to attract more business and wants to know if average daily sales have increased. historically average daily sales were approximately $2,700. the upper bound of the 95% range of likely sample means for this one-sided test is approximately $2,843.44. if the owner took a random sample of forty-five days and found that daily average sales were now $2,984, what can she conclude at the 95% confidence level?
Answers: 1
Mathematics, 21.06.2019 21:00
Rewrite the following quadratic functions in intercept or factored form. show your work. f(t) = 20t^2 + 14t - 12
Answers: 1
Mathematics, 21.06.2019 22:00
20 points 1. your friend, taylor, missed class today and needs some identifying solutions to systems. explain to taylor how to find the solution(s) of any system using its graph. 2. taylor graphs the system below on her graphing calculator and decides that f(x)=g(x) at x=0, x=1, and x=3. provide taylor some feedback that explains which part of her answer is incorrect and why it is incorrect. f(x)=2x+1 g(x)=2x^2+1
Answers: 2
You know the right answer?
These box plots show the number of electoral votes won by Democratic and
Republican presidential c...
Questions

History, 23.11.2020 19:10
Mathematics, 23.11.2020 19:10


Mathematics, 23.11.2020 19:10
Mathematics, 23.11.2020 19:10

Geography, 23.11.2020 19:10
Mathematics, 23.11.2020 19:10
Mathematics, 23.11.2020 19:10

Mathematics, 23.11.2020 19:10


