
Mathematics, 23.10.2021 17:30 anaaaa46
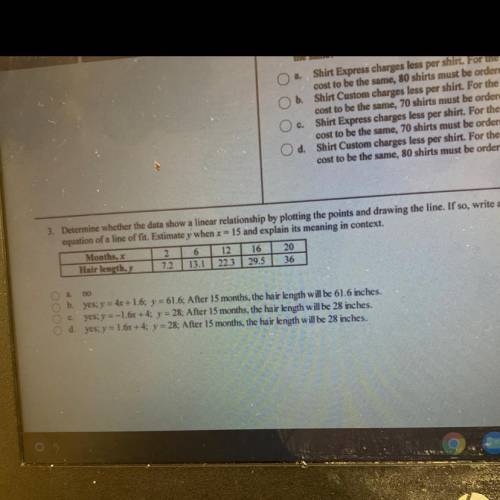
3. Determine whether the data show a linear relationship by plotting the points and drawing the line. If so, write an
equation of a line of fit. Estimate y when x = 15 and explain its meaning in context.
Months,
2 6 12 16 20
Hair length,
7.2 13.1 22.3 29.5 36
no
b. yes: y = 4x+1.6: y =61.6: After 15 months, the hair length will be 61.6 inches.
c. yes: y=-1.6x +4: y = 28: After 15 months, the hair length will be 28 inches.
d. yes: y = 1.67 +4; y = 28: After 15 months, the hair length will be 28 inches

Answers: 3


Another question on Mathematics
Mathematics, 20.06.2019 18:04
Hiroki wrote a number that is the opposite of -3. what number did hiroki write? a. ⅓ b. 3 c. 0 d. -3
Answers: 2
Mathematics, 21.06.2019 20:00
Ialready asked this but i never got an answer. will give a high rating and perhaps brainliest. choose the linear inequality that describes the graph. the gray area represents the shaded region. y ≤ –4x – 2 y > –4x – 2 y ≥ –4x – 2 y < 4x – 2
Answers: 1
Mathematics, 21.06.2019 23:00
Find the rate at which the water is now flowing from the tap give your answer cubic centimetres per second
Answers: 1
Mathematics, 22.06.2019 00:00
Asequence has a common ratio of and f(5) = 81. which explicit formula represents the sequence? f(x) = 24 f(x) = 16 f(x) = 24 f(x) = 16
Answers: 1
You know the right answer?
3. Determine whether the data show a linear relationship by plotting the points and drawing the line...
Questions

Biology, 30.03.2020 20:22
Mathematics, 30.03.2020 20:22


Mathematics, 30.03.2020 20:23
Mathematics, 30.03.2020 20:23

English, 30.03.2020 20:23
Mathematics, 30.03.2020 20:23

Chemistry, 30.03.2020 20:23
English, 30.03.2020 20:23

History, 30.03.2020 20:23
Mathematics, 30.03.2020 20:23
English, 30.03.2020 20:23
English, 30.03.2020 20:23


