
Mathematics, 26.10.2021 15:40 javondailey2891
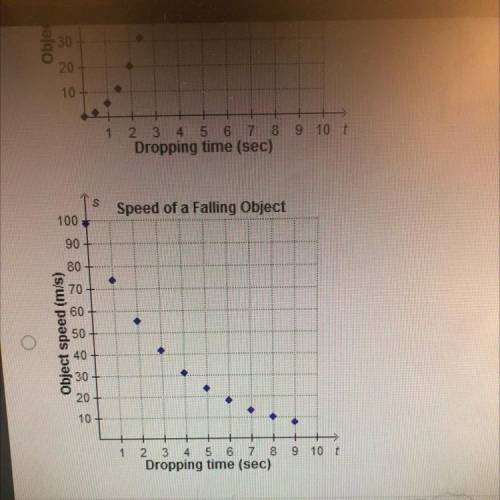
The speed of a falling object increases at a constant rate as time increases since the object was dropped Which
graph could represent the relationship between t time in seconds and s, speed in meters per second?
Speed of a Falling Object
100
90
80
70
60
Object speed (m/s)
20
10
9 10
8
Dropping time (sec)
.
Speed of a Falling Object
100
90
Mark this and return
NEX

Answers: 3


Another question on Mathematics
Mathematics, 21.06.2019 17:30
8000 + 8800 + 8000 + 8 million + 80 trillion + another a katrillion equals
Answers: 1
Mathematics, 21.06.2019 19:40
Which of the following three dimensional figures has a circle as it’s base
Answers: 2
Mathematics, 21.06.2019 20:30
You’re giving a cube with a length of 2.5 cm and a width of 2.5 cm and a high of 2.5 cm you place it on a scale and it is 295 g calculate the density
Answers: 1
You know the right answer?
The speed of a falling object increases at a constant rate as time increases since the object was dr...
Questions

History, 27.09.2019 05:30
Mathematics, 27.09.2019 05:30
Mathematics, 27.09.2019 05:30


Mathematics, 27.09.2019 05:30
Mathematics, 27.09.2019 05:30


Chemistry, 27.09.2019 05:30
Mathematics, 27.09.2019 05:30
Mathematics, 27.09.2019 05:30
Mathematics, 27.09.2019 05:30
Mathematics, 27.09.2019 05:30


