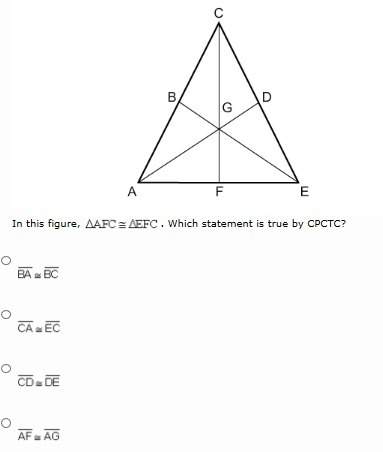
Which of the following is a diverse graph?
A. Height of plant growing over time.
B. Nu...

Mathematics, 27.10.2021 01:00 uehlingt39
Which of the following is a diverse graph?
A. Height of plant growing over time.
B. Number of town visitors over time.
C. Temperature of food while cooking.
D. Height of a person over time.

Answers: 1


Another question on Mathematics

Mathematics, 22.06.2019 02:50
1. how do you find p(a and b) if a and b are dependent events for two or more actions, such as selecting two candies and drawing p(green, and then pink)?
Answers: 1


Mathematics, 22.06.2019 04:00
Pls i’m super dumb and i need with this one it’s due tomorrow
Answers: 2

Mathematics, 22.06.2019 04:40
The accompanying normal probability plot was constructed from a sample of 30 readings on tension for mesh screens behind the surface of video display tubes used in computer monitors. does it appear plausible that the tension distribution is normal? the given probability is has a significant downward curve, so it is plausible that the tension distribution is normal. the given probability is has a significant downward curve, so it is not plausible that the tension distribution is normal. the given probability is quite linear, so it is plausible that the tension distribution is normal. the given probability is has a significant upward curve, so it is not plausible that the tension distribution is normal. the given probability is quite linear, so it is not plausible that the tension distribution is normal.
Answers: 1
You know the right answer?
Questions


Mathematics, 20.11.2020 19:50


Chemistry, 20.11.2020 19:50

Geography, 20.11.2020 19:50


Spanish, 20.11.2020 19:50

English, 20.11.2020 19:50

Business, 20.11.2020 19:50


Business, 20.11.2020 19:50

History, 20.11.2020 19:50

Mathematics, 20.11.2020 19:50

Mathematics, 20.11.2020 19:50

Mathematics, 20.11.2020 19:50

Mathematics, 20.11.2020 19:50


