
Mathematics, 27.10.2021 23:40 andrejr0330jr
Step 3: Making predictions using data
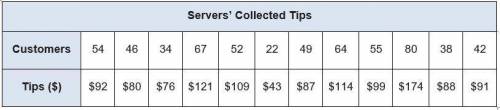
You and your business partner track the number of customers served and the amount of tips collected per day. The data you gathered is displayed in the chart below.
Servers’ Collected Tips
Customers 54 46 34 67 52 22 49 64 55 80 38 42
Tips ($) $92 $80 $76 $121 $109 $43 $87 $114 $99 $174 $88 $91
a) Create a scatterplot displaying the data in the table. Be sure to include a linear trend line. (2 points)
b) Find the equation of the trend line (line of best fit). Show your work. (2 points)
c) Predict the amount of tips that would be collected if 100 customers were served at the restaurant on a given day. Explain your reasoning. (2 points)
d) Explain how to use the regression calculator to make a reasonable prediction given a data table. (2 points)
100 points!

Answers: 3


Another question on Mathematics
Mathematics, 21.06.2019 17:00
Arestaurant offers a $12 dinner special that has 5 choices for an appetizer, 12 choices for an entrée, and 4 choices for a dessert. how many different meals are available when you select an appetizer, an entrée, and a dessert? a meal can be chosen in nothing ways. (type a whole number.)
Answers: 1
Mathematics, 21.06.2019 17:30
The sum of two numbers is 12 and their difference is 18 what are the two numbers
Answers: 1
You know the right answer?
Step 3: Making predictions using data
You and your business partner track the number of customers...
Questions

Mathematics, 09.04.2021 02:40

Physics, 09.04.2021 02:40

Mathematics, 09.04.2021 02:40

Mathematics, 09.04.2021 02:40
Biology, 09.04.2021 02:40

Physics, 09.04.2021 02:40
Mathematics, 09.04.2021 02:40
Mathematics, 09.04.2021 02:40

Law, 09.04.2021 02:40
Physics, 09.04.2021 02:40
Mathematics, 09.04.2021 02:40

Mathematics, 09.04.2021 02:40
History, 09.04.2021 02:40
History, 09.04.2021 02:40


