X-1
Which graph shows the solution set of X-3
*-} <0?
O
+++
-5 -4 -3 -2...

Mathematics, 30.10.2021 14:00 savannah19dw
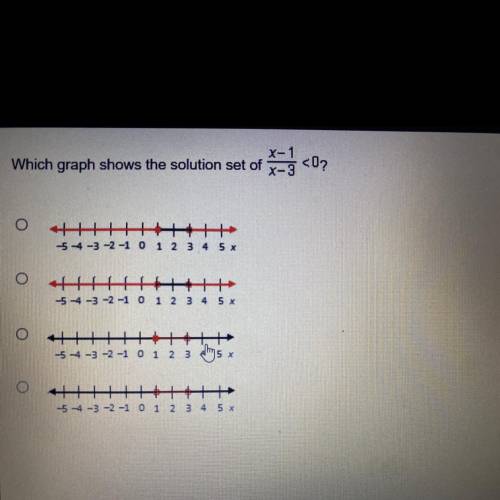
X-1
Which graph shows the solution set of X-3
*-} <0?
O
+++
-5 -4 -3 -2 -1 0
1 2 3 4 5 X
H
-5 -4 -3 -2 -1 0
1 2 3
4 5 x
H
-5 -4 -3 -2 -1 0 1 2 3 4 5 X
HH
-5 -4 -3 -2 -1 0 1 2 3 4 5 x

Answers: 2


Another question on Mathematics
Mathematics, 21.06.2019 20:20
Consider the following estimates from the early 2010s of shares of income to each group. country poorest 40% next 30% richest 30% bolivia 10 25 65 chile 10 20 70 uruguay 20 30 50 1.) using the 4-point curved line drawing tool, plot the lorenz curve for bolivia. properly label your curve. 2.) using the 4-point curved line drawing tool, plot the lorenz curve for uruguay. properly label your curve.
Answers: 2
Mathematics, 21.06.2019 22:30
The median for the given set of six ordered data values is 29.5 9 12 25 __ 41 48 what is the missing value?
Answers: 1
Mathematics, 21.06.2019 22:30
What three-dimensional solid have 6 rectangular faces, 2 equal bases that are not rectangles and 18 edges
Answers: 3
Mathematics, 22.06.2019 01:30
Arecent study focused on the number of times men and women who live alone buy take-out dinner in a month. assume that the distributions follow the normal probability distribution and the population standard deviations are equal. the information is summarized below. statistic men women sample mean 24.85 21.33 sample standard deviation 5.54 4.93 sample size 34 36 at the 0.01 significance level, is there a difference in the mean number of times men and women order take-out dinners in a month? state the decision rule for 0.01 significance level: h0: μmen= μwomen h1: μmen ≠ μwomen. (negative amounts should be indicated by a minus sign. round your answers to 3 decimal places.) compute the value of the test statistic. (round your answer to 3 decimal places.) what is your decision regarding the null hypothesis? what is the p-value? (round your answer to 3 decimal places.)
Answers: 1
You know the right answer?
Questions

Mathematics, 26.04.2021 22:00

English, 26.04.2021 22:00
Mathematics, 26.04.2021 22:00

Chemistry, 26.04.2021 22:00
Mathematics, 26.04.2021 22:00
Mathematics, 26.04.2021 22:00
Mathematics, 26.04.2021 22:00
Mathematics, 26.04.2021 22:00
Mathematics, 26.04.2021 22:00
Mathematics, 26.04.2021 22:00

History, 26.04.2021 22:00
Chemistry, 26.04.2021 22:00

Computers and Technology, 26.04.2021 22:00
Mathematics, 26.04.2021 22:00


