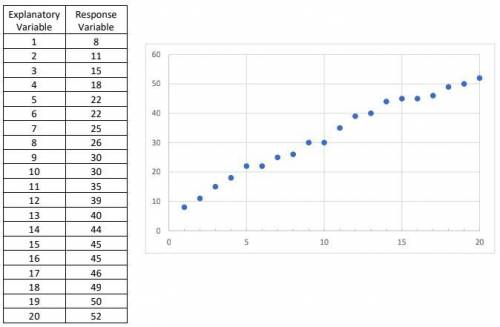
A researcher collected the following bivariate data.
(Shown in image below)
Part A Craft a s...

Mathematics, 04.11.2021 14:00 kendrabrown41
A researcher collected the following bivariate data.
(Shown in image below)
Part A Craft a scenario that could be modeled by this set of data. You will be using this scenario to answer the rest of this question. (8 points)
Part B Calculate and interpret the value of the Coefficient of Determination and Correlation Coefficient. (8 points)
Part C Using the context you identified in Part A, comment on the association between these two variables. (8 points)
Part D Write the equation of the least-squares regression line for these data. Be sure to clearly define your variables, using the context from Part A. (8 points)
Part E Find the residual value for x = 16. Interpret this value in the context you identified in Part A. (8 points)

Answers: 1


Another question on Mathematics
Mathematics, 21.06.2019 14:30
Use the radius you found in part i (r=26.8 cm) with the surface area formula below to find the surface area of the sphere. show your work and round your answer to the nearest tenth. the surface area of a sphere: sa = 4πr^2 self note: 3.8.4
Answers: 2
Mathematics, 22.06.2019 00:00
Determine the function’s value when x = -1 a. g(-1)=-3 b. g(-1)=0 c. g(-1)=1 d. g(-1)=27
Answers: 2
You know the right answer?
Questions
Mathematics, 02.09.2021 01:00

English, 02.09.2021 01:00
Mathematics, 02.09.2021 01:00


Biology, 02.09.2021 01:00
Mathematics, 02.09.2021 01:00

Chemistry, 02.09.2021 01:00
Mathematics, 02.09.2021 01:00
Mathematics, 02.09.2021 01:00
Mathematics, 02.09.2021 01:00
Chemistry, 02.09.2021 01:00


Chemistry, 02.09.2021 01:00


