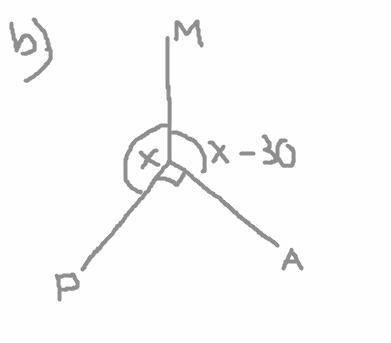
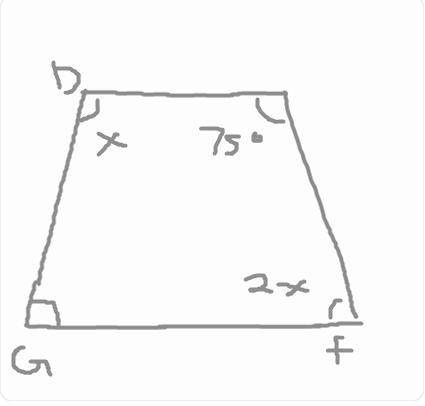
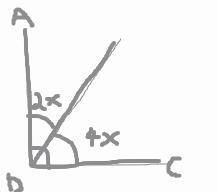
Find the value of x in the following diagrams (I drew them instead)
...

Mathematics, 24.11.2021 05:10 hvvhvc
Find the value of x in the following diagrams (I drew them instead)


Answers: 3


Another question on Mathematics
Mathematics, 21.06.2019 15:00
Jeffery conducted a survey in his school and found that 30 of the 50 eighth grade students' favorite subject is mathematics. based on the results, jeffery concluded that out of the 200 students in his school, 120 students' favorite subject is mathematics. select the statement that is true about jeffery's conclusion. a. jeffery's conclusion is not valid because the sample was biased since only 200 students were surveyed. b. jeffery's conclusion is valid because the sample was random since all of the students were eighth grade students. c. jeffery's conclusion is valid because the sample was random. d. jeffery's conclusion is not valid because the sample was biased since all of the students were eighth grade students.
Answers: 2
Mathematics, 21.06.2019 15:00
Mindy bought 5/8 pound of almonds and a 3/4 pound of walnuts.which pair of fraction cannot be used to find how many pounds of nuts she bought in all.
Answers: 2
Mathematics, 21.06.2019 19:40
The owners of four companies competing for a contract are shown in the table below. if a report is released that advocates company b, which of the people having funded the report should result in the most skepticism? company owner of company company a jake adams company b company c company d debby smith henry rose rhonda baker o a. jake adams o b. rhonda baker o c. debby smith o d. henry rose
Answers: 2
Mathematics, 22.06.2019 01:00
The weight of 46 new patients of a clinic from the year 2018 are recorded and listed below. construct a frequency distribution, using 7 classes. then, draw a histogram, a frequency polygon, and an ogive for the data, using the relative information from the frequency table for each of the graphs. describe the shape of the histogram. data set: 130 192 145 97 100 122 210 132 107 95 210 128 193 208 118 196 130 178 187 240 90 126 98 194 115 212 110 225 187 133 220 218 110 104 201 120 183 124 261 270 108 160 203 210 191 180 1) complete the frequency distribution table below (add as many rows as needed): - class limits - class boundaries - midpoint - frequency - cumulative frequency 2) histogram 3) frequency polygon 4) ogive
Answers: 1
You know the right answer?
Questions


History, 26.05.2021 21:10


English, 26.05.2021 21:10
English, 26.05.2021 21:10
Mathematics, 26.05.2021 21:10


Chemistry, 26.05.2021 21:10
Mathematics, 26.05.2021 21:10
English, 26.05.2021 21:10
Mathematics, 26.05.2021 21:10
Mathematics, 26.05.2021 21:10


