
Mathematics, 25.11.2021 08:50 pecanpielover04
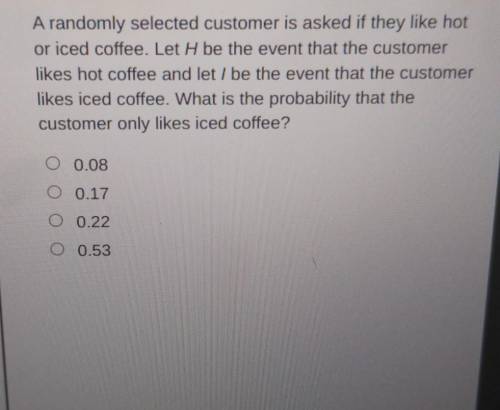
According to sales records at a local coffee shop, 75% of all customers like hot coffee, 30% like iced coffee, and 22% like both hot and iced coffee. The Venn diagram displays the coffee preferences of the customers.

Answers: 3


Another question on Mathematics
Mathematics, 21.06.2019 13:00
Find the value of a. the diagram is not to scale. a quadrilateral is drawn. the upper and lower sides are parallel. the interior angle in the upper left corner is labeled a degrees. the angle in the upper right corner is labeled 113 degrees. the angle in the lower right corner is labeled b degrees. the angle in the lower left corner is labeled 36 degrees. a. 36 b. 144 c. 54 d. 126
Answers: 1
Mathematics, 21.06.2019 17:00
Drag the tiles to the correct boxes to complete the pairs. match the cart-coordinates with their corresponding pairs of y-coordinates of the unit circle
Answers: 3
Mathematics, 21.06.2019 20:10
Suppose g(x) = f(x + 3) + 4. which statement best compares the graph of g(x) with the graph of f(x)?
Answers: 2
Mathematics, 21.06.2019 22:30
Question 3(multiple choice worth 1 points) use the arc length formula and the given information to find r. s = 16 cm, θ = 48°; r = ? sixty divided by pi cm thirty divided by pi cm one third cm one hundred twenty divided by pi cm
Answers: 1
You know the right answer?
According to sales records at a local coffee shop, 75% of all customers like hot coffee, 30% like ic...
Questions

Mathematics, 16.04.2020 22:24


Chemistry, 16.04.2020 22:24
Mathematics, 16.04.2020 22:24
Mathematics, 16.04.2020 22:24

Biology, 16.04.2020 22:24

Mathematics, 16.04.2020 22:24
History, 16.04.2020 22:24


