
Mathematics, 29.11.2021 19:00 anabellabenzaquen
Determine whether the graph shows a positive correlation, a negative correlation, or no correlation. If there is a positive or negative correlation, describe its meaning in the situation.
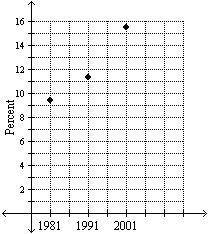
Women in the Army
A graph titled Women in the Army has year on the x-axis, from 1981 to 2001 in increments of 10, and percent on the y-axis, from 0 to 16 in increments of 2. Points are at (1981, 9.3), (1991, 11.3), (2001, 15.8).
Year
Source: Time Magazine, March 24, 2003
a.
positive; as time goes on, more women are in the army.
b.
no correlation
c.
negative; as time goes on, fewer women are in the army.
d.
negative; as time goes on, more women are in the army.
Please select the best answer from the choices provided
A
B
C
D

Answers: 1


Another question on Mathematics
Mathematics, 21.06.2019 14:00
Given the conditional statement, match the following. conditional statement: if two lines intersect, then their intersection is one point.
Answers: 1
Mathematics, 21.06.2019 19:20
Thompson and thompson is a steel bolts manufacturing company. their current steel bolts have a mean diameter of 127 millimeters, and a variance of 36. if a random sample of 35 steel bolts is selected, what is the probability that the sample mean would differ from the population mean by greater than 0.5 millimeters? round your answer to four decimal places.
Answers: 3
Mathematics, 21.06.2019 19:50
If the scale factor between two circles is 2x/5y what is the ratio of their areas?
Answers: 3
Mathematics, 21.06.2019 20:30
Which steps could be part of the process in algebraically solving the system of equations, y+5x=x^2+10 and y=4x-10
Answers: 2
You know the right answer?
Determine whether the graph shows a positive correlation, a negative correlation, or no correlation....
Questions
Mathematics, 23.06.2020 23:01
Mathematics, 23.06.2020 23:01

Advanced Placement (AP), 23.06.2020 23:01


Mathematics, 23.06.2020 23:01

Mathematics, 23.06.2020 23:01
Mathematics, 23.06.2020 23:01


