
Mathematics, 30.11.2021 18:20 cielo2761
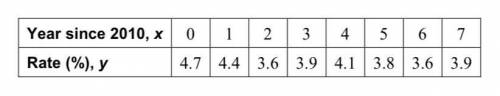
The table shows the mortgage interest rates y at a local bank for the years 2010 through 2017.
a. Make a scatter plot of the data.
b. Draw a line of best fit.
c. Write an equation of the line of best fit.
d. Interpret the slope of the line of best fit.
e. Assuming this trend continues, what would be the mortgage interest rate for the year 2020? Explain your reasoning.
f. Identify and interpret the correlation coefficient.

Answers: 2


Another question on Mathematics
Mathematics, 21.06.2019 18:30
What is the prime factorization of 23 ?me with this question
Answers: 1
Mathematics, 21.06.2019 22:20
Let f(x) = 5/x and g(x)=2x2+5x. what two numbers are not in the domain of f o g
Answers: 2
Mathematics, 22.06.2019 02:30
Me answer this question: -2/3p + 1/5 - 1 + 5/6p i think the simplified expression is 1/6p - 4/5 correct me if i'm wrong, and explain it! if i have it right, just tell me. you so
Answers: 1
Mathematics, 22.06.2019 04:00
Awoman won a 4000-m race with a time of 12.089 min. what was her rate?
Answers: 1
You know the right answer?
The table shows the mortgage interest rates y at a local bank for the years 2010 through 2017.
a....
Questions
Mathematics, 21.08.2020 04:01


Mathematics, 21.08.2020 04:01
Mathematics, 21.08.2020 04:01
Mathematics, 21.08.2020 04:01

Mathematics, 21.08.2020 04:01


Mathematics, 21.08.2020 04:01

History, 21.08.2020 05:01


