
Mathematics, 30.11.2021 18:20 wrerteteT2827
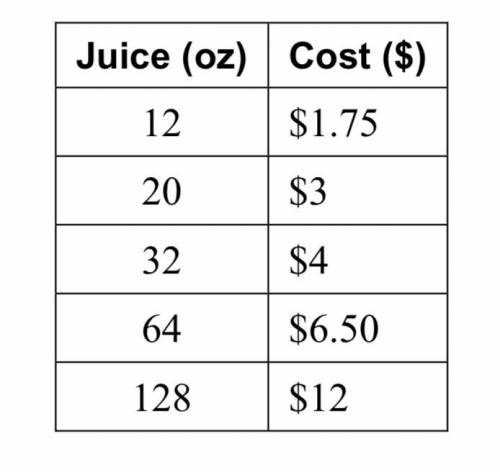
The table shows the costs(in dollars)of bottles of juice(influidounces).
a. make a scatter plot of the data and draw a line of best fit.
b. write an equation of the line of best fit.
c. interpret the slope and the y-intercept of the line of best fit.
d. assuming this trend continues, what would be the cost of a 256-fluid ounce container of juice? explain your reasoning.
e. identify and interpret the correlation coefficient

Answers: 3


Another question on Mathematics
Mathematics, 21.06.2019 15:20
Angle mno is s rotated 180 degrees counterclockwise about the origin to form angle m’n’o’. which statement shows the measure of angle m’n’o’?
Answers: 1
Mathematics, 21.06.2019 16:00
Aline has a slope of 1/4 and passes through point (0.4,-1/2). what is the value of the y-intercept?
Answers: 2
Mathematics, 21.06.2019 19:00
Write the pair of fractions as a pair of fractions with a common denominator
Answers: 3
Mathematics, 21.06.2019 21:50
Which is the graph of this function 3 square root of x plus one if
Answers: 1
You know the right answer?
The table shows the costs(in dollars)of bottles of juice(influidounces).
a. make a scatter plot of...
Questions


History, 13.11.2020 20:10

Chemistry, 13.11.2020 20:10
Mathematics, 13.11.2020 20:10

Mathematics, 13.11.2020 20:10

Social Studies, 13.11.2020 20:10
Chemistry, 13.11.2020 20:10

English, 13.11.2020 20:10
Mathematics, 13.11.2020 20:10
English, 13.11.2020 20:10


