
Mathematics, 01.12.2021 09:30 Prettypq
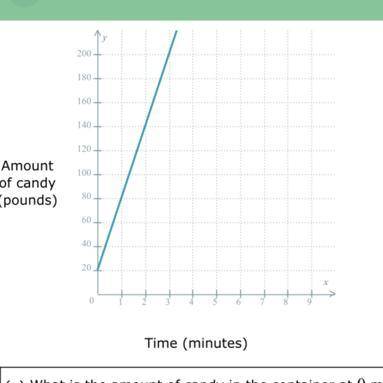
At a candy factory, a machine is putting candy into a container. the graph shows the amount of candy (in pounds) in the container vs time (in minutes). SEE GRAPH BELOW AND ANSWER THE FOLLOWING QUESTIONS PLEASE.
A.) What is the amount of candy in the container at 0 minutes?
B.)Choose the stament that best describes how the time and candy are related then fill in the blank.
B 1.) As time increases the amount of candy in the container decreases. At what rate is the amount of candy decreasing?
_ pounds per minute?
B 2.) As time increases the amount of candy in the container increases. At what rate is the amount of candy increasing?
_pounds per minute?

Answers: 2


Another question on Mathematics
Mathematics, 21.06.2019 18:30
What can each term of the equation be multiplied by to eliminate the fractions before solving? x – + 2x = + x 2 6 10 12
Answers: 2
Mathematics, 21.06.2019 20:00
How many sides does a regular polygon have if each exterior angle measure is 45 degrees explain your answer, i really don't understand this.
Answers: 1
Mathematics, 21.06.2019 23:30
On the day a coffee shop first opened, it had 140 customers. 65% of the customers ordered a large coffee. how many customers ordered a large coffee? enter your answer in the box.
Answers: 1
You know the right answer?
At a candy factory, a machine is putting candy into a container. the graph shows the amount of candy...
Questions


Business, 23.07.2019 12:40

Social Studies, 23.07.2019 12:40
Biology, 23.07.2019 12:40


