The histogram shows information about how 550 people travel to work.
40+
b)
He travels...

Mathematics, 01.12.2021 14:00 alexis3567
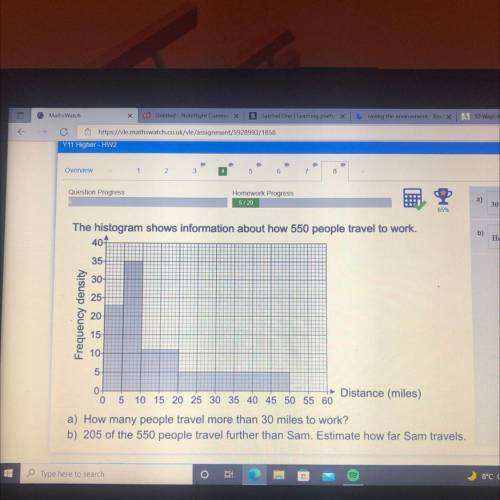
The histogram shows information about how 550 people travel to work.
40+
b)
He travels
35
30
25
Frequency density
20
15
10
5
0
0
5 10 15 20 25 30 35 40 45 50 55 60
Distance (miles)
a) How many people travel more than 30 miles to work?

Answers: 2


Another question on Mathematics
Mathematics, 21.06.2019 17:10
The average number of vehicles waiting in line to enter a parking lot can be modeled by the function f left parenthesis x right x squared over 2 left parenthesis 1 minus x right parenthesis endfraction , where x is a number between 0 and 1 known as the traffic intensity. find the rate of change of the number of vehicles waiting with respect to the traffic intensity for the intensities (a) xequals0.3 and (b) xequals0.6.
Answers: 1
Mathematics, 21.06.2019 19:30
Factor the following expression. 27y3 – 343 a. (3y + 7)(9y2 + 2ly + 49) b. (3y – 7)(9y2 + 2ly + 49) c. (3y – 7)(932 – 217 + 49) d. (3y + 7)(92 – 2ly + 49)
Answers: 1
Mathematics, 21.06.2019 19:30
Complete the solution of the equation. find the value of y when x equals to 28 x+3y=28
Answers: 2
Mathematics, 21.06.2019 22:30
What three-dimensional solid have 6 rectangular faces, 2 equal bases that are not rectangles and 18 edges
Answers: 3
You know the right answer?
Questions

Geography, 18.02.2021 01:30
Mathematics, 18.02.2021 01:30

Mathematics, 18.02.2021 01:30
Mathematics, 18.02.2021 01:30

Mathematics, 18.02.2021 01:30
Geography, 18.02.2021 01:30
Mathematics, 18.02.2021 01:30

Chemistry, 18.02.2021 01:30
Mathematics, 18.02.2021 01:30
Mathematics, 18.02.2021 01:30
Mathematics, 18.02.2021 01:30

History, 18.02.2021 01:30
Mathematics, 18.02.2021 01:30
Mathematics, 18.02.2021 01:30


