
Mathematics, 06.12.2021 16:10 krishawnnn
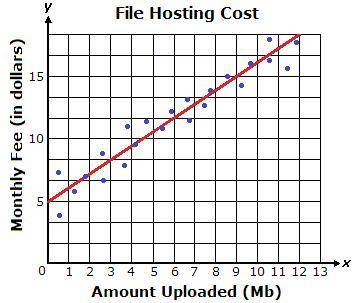
The graph below shows a line of best fit for data collected on the amount customers spent on a file sharing service in relation to the amount they uploaded.
The equation of the line of best fit is shown below.
Y = 10/9x + 5
What does the y-intercept represent?
A.
the cost to enroll in the file sharing service
B.
the cost per file uploaded
C.
the cost to upload an unlimited amount of files
D.
the cost per Mb uploaded

Answers: 2


Another question on Mathematics
Mathematics, 21.06.2019 19:00
The quadratic function h(t)=-16.1t^2+150 choose the graph representation
Answers: 1
Mathematics, 21.06.2019 21:30
Are the corresponding angles congruent? explain why or why not.
Answers: 2
Mathematics, 21.06.2019 21:40
Question 1 of 10 2 points different groups of 50 graduates of an engineering school were asked the starting annual salary for their first engineering job after graduation, and the sampling variability was low. if the average salary of one of the groups was $65,000, which of these is least likely to be the average salary of another of the groups? o a. $64,000 o b. $65,000 o c. $67,000 o d. $54,000
Answers: 2
You know the right answer?
The graph below shows a line of best fit for data collected on the amount customers spent on a file...
Questions
SAT, 15.02.2022 20:40


Biology, 15.02.2022 20:40
SAT, 15.02.2022 20:40

Mathematics, 15.02.2022 20:40

Chemistry, 15.02.2022 20:40
English, 15.02.2022 20:40


