
Mathematics, 07.12.2021 18:00 MysteryDove12
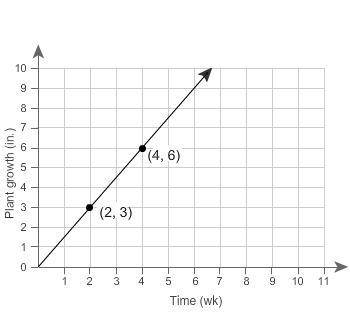
Relationship B has a lesser rate than Relationship A. This graph represents Relationship A.
What table could represent Relationship B?
Time (weeks) 3 6 8 10
Plant growth (in.) 4.8 9.6 12.8 16
Time (weeks) 3 4 6 9
Plant growth (in.) 5.4 7.2 10.8 16.2
Time (weeks) 3 4 6 9
Plant growth (in.) 6.3 8.4 12.6 18.9
Please give explanation ands how your work so I can understand on how you got that answer.
This graph is down below

Answers: 2


Another question on Mathematics
Mathematics, 21.06.2019 16:20
The number of nails of a given length is normally distributed with a mean length of 5.00 in, and a standard deviation of 0.03 in. find the number of nails in a bag of 120 that are less than 4.94 in. long.
Answers: 3
Mathematics, 21.06.2019 18:00
Give all possible names for the line shown.calculation tip: lines can be written with either point first.
Answers: 1
Mathematics, 21.06.2019 21:40
Which statement is true about a number and its additive inverse? a. their product is always one. b. their sum is always one. c. they are always reciprocals of each other. d. their sum is always zero.
Answers: 1
Mathematics, 21.06.2019 22:00
Find two consexutive odd integers such that the sum of their square is 650
Answers: 2
You know the right answer?
Relationship B has a lesser rate than Relationship A. This graph represents Relationship A.
What t...
Questions

History, 05.11.2020 05:40
Mathematics, 05.11.2020 05:40
Mathematics, 05.11.2020 05:40


Biology, 05.11.2020 05:40

Chemistry, 05.11.2020 05:40
Biology, 05.11.2020 05:40
Mathematics, 05.11.2020 05:40

Biology, 05.11.2020 05:40
Mathematics, 05.11.2020 05:40

English, 05.11.2020 05:40


