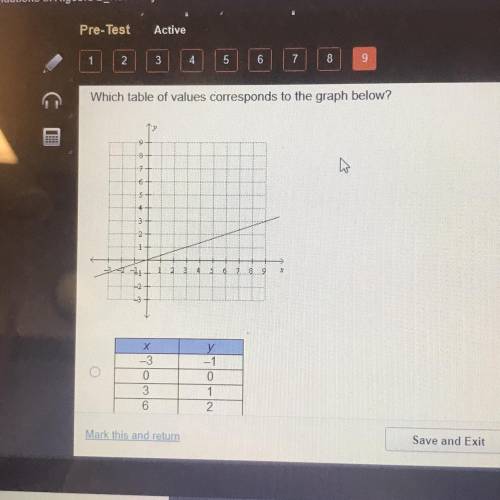
Which table of values corresponds to the graph below?
9
4
45
8 9
х
-...

Mathematics, 08.12.2021 17:50 alexcarrasco5903
Which table of values corresponds to the graph below?
9
4
45
8 9
х
-3
0
3
6
у
-1
0
1
2
Mark this and return
Save and Exit

Answers: 2


Another question on Mathematics
Mathematics, 21.06.2019 20:00
M the table below represents a linear function f(x) and the equation represents a function g(x): x f(x)−1 −50 −11 3g(x)g(x) = 2x − 7part a: write a sentence to compare the slope of the two functions and show the steps you used to determine the slope of f(x) and g(x). (6 points)part b: which function has a greater y-intercept? justify your answer. (4 points)
Answers: 3
Mathematics, 21.06.2019 21:30
Acoffee shop orders at most $3,500 worth of coffee and tea. the shop needs to make a profit of at least $1,900 on the order. the possible combinations of coffee and tea for this order are given by this system of inequalities, where c = pounds of coffee and t = pounds of tea: 6c + 13t ≤ 3,500 3.50c + 4t ≥ 1,900 which graph's shaded region represents the possible combinations of coffee and tea for this order?
Answers: 1
Mathematics, 21.06.2019 22:10
Erinn wrote the equation –5x + 4y = 32 to represent her hourly wage (y) and how this wage has changed during each year that she worked at a company (x). what is the rate of change in erinn's hourly wage per year?
Answers: 2
Mathematics, 22.06.2019 01:30
The angle of elevation from point a to the top of a cliff is 38 degrees . if point a is 80 feet from the base of the cliff , how high is the cliff ?
Answers: 3
You know the right answer?
Questions


Mathematics, 21.04.2020 18:04


Mathematics, 21.04.2020 18:04


