Mathematics, 08.12.2021 19:20 chimwim7515
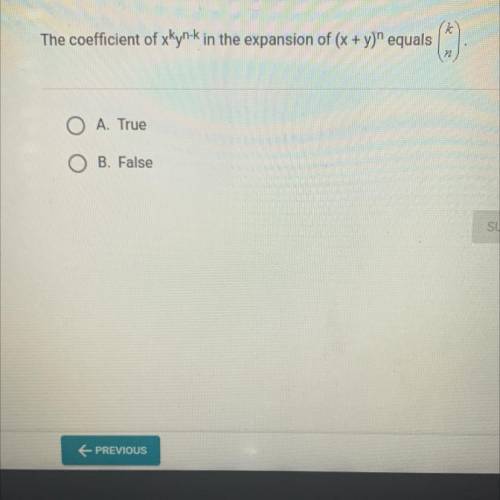
The coefficient of x ^ k * y ^ (n - k) in the expansion of (x + y) ^ n equals binomial(k, n) O A. True OB. False


Answers: 2


Another question on Mathematics

Mathematics, 21.06.2019 14:00
Question 1(multiple choice worth 1 points)(07.06 mc)a group of students must collect at least $150 to organize a science fair. they have already collected $30. which graph best represents all remaining amounts of money, in dollars, that thestudents should still collect to organize the science fair? -210 -180 -150 - 120 -90-60 -300306090 120 150 180 210-210 -180 -150 - 120 -90 -60 -30 0 30 60 90 120 150 180 210-210 -180-150 - 120 -90-60-300 30 60 90 120 150 180 210-210 -180 -150 - 120.90 -60 -30 0 30 60 90 120 150 180 210
Answers: 3

Mathematics, 21.06.2019 16:10
Convert 50 kilogram to pounds. (the conversion factor from kilogram to pound is 2.2046.) a. 52.2 lb. b. 110.2 lb. c. 22.6 lb. d. 47.8 lb.
Answers: 1

Mathematics, 21.06.2019 16:20
Apolynomial function has a root of –6 with multiplicity 1, a root of –2 with multiplicity 3, a root of 0 with multiplicity 2, and a root of 4 with multiplicity 3. if the function has a positive leading coefficient and is of odd degree, which statement about the graph is true?
Answers: 2

Mathematics, 22.06.2019 03:00
Describe how the presence of possible outliers might be identified on the following. (a) histograms gap between the first bar and the rest of bars or between the last bar and the rest of bars large group of bars to the left or right of a gap higher center bar than surrounding bars gap around the center of the histogram higher far left or right bar than surrounding bars (b) dotplots large gap around the center of the data large gap between data on the far left side or the far right side and the rest of the data large groups of data to the left or right of a gap large group of data in the center of the dotplot large group of data on the left or right of the dotplot (c) stem-and-leaf displays several empty stems in the center of the stem-and-leaf display large group of data in stems on one of the far sides of the stem-and-leaf display large group of data near a gap several empty stems after stem including the lowest values or before stem including the highest values large group of data in the center stems (d) box-and-whisker plots data within the fences placed at q1 â’ 1.5(iqr) and at q3 + 1.5(iqr) data beyond the fences placed at q1 â’ 2(iqr) and at q3 + 2(iqr) data within the fences placed at q1 â’ 2(iqr) and at q3 + 2(iqr) data beyond the fences placed at q1 â’ 1.5(iqr) and at q3 + 1.5(iqr) data beyond the fences placed at q1 â’ 1(iqr) and at q3 + 1(iqr)
Answers: 1
You know the right answer?
The coefficient of x ^ k * y ^ (n - k) in the expansion of (x + y) ^ n equals binomial(k, n) O A. Tr...
Questions


Mathematics, 31.08.2020 01:01

English, 31.08.2020 01:01

Mathematics, 31.08.2020 01:01


History, 31.08.2020 01:01


Mathematics, 31.08.2020 01:01


Chemistry, 31.08.2020 01:01

Mathematics, 31.08.2020 01:01


Mathematics, 31.08.2020 01:01


English, 31.08.2020 01:01

Biology, 31.08.2020 01:01


