
Mathematics, 08.12.2021 19:50 lindalou6483
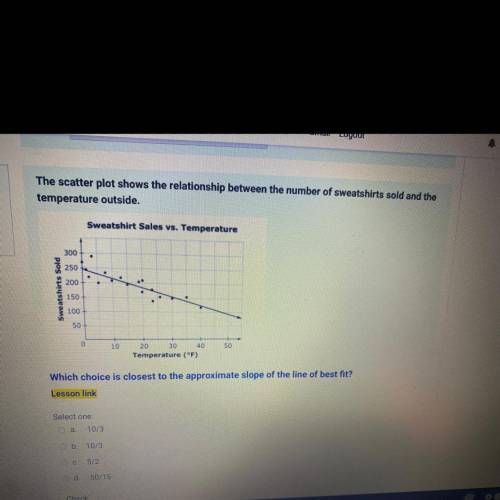
The scatter plot shows the relationship between the number of sweatshirts sold and the
temperature outside.
Sweatshirt Sales vs. Temperature
300
250
200
Sweatshirts Sold
150
100
50
10
50
20 30 40
Temperature (°F)
Which choice is closest to the approximate slope of the line of best fit?
Lesson link
Select one
a 10/3
b
10/3
c
52
d
50/15

Answers: 3


Another question on Mathematics
Mathematics, 21.06.2019 16:00
What is the length of the unknown leg in the right triangle ?
Answers: 2
Mathematics, 21.06.2019 18:00
For a field trip to the zoo, 4 students rode in cars and the rest filled nine busess. how many students were in each bus if 472 students were on the trip
Answers: 1
Mathematics, 21.06.2019 22:30
]supplementary angles are two angles that add up to . • complementary angles are two angles that add up to degrees. • adjacent angles share a and a • congruent angles have the measure. • an triangle has one angle that is greater than 90 degrees. • a triangle with angles 45°, 45°, and 90° would be a triangle
Answers: 2
Mathematics, 21.06.2019 22:30
Awindow washer cleans 42 windows in 2 hours. at this rate, how many windows did he clean in 180 minutes.
Answers: 2
You know the right answer?
The scatter plot shows the relationship between the number of sweatshirts sold and the
temperature...
Questions


Chemistry, 05.12.2020 01:00
Mathematics, 05.12.2020 01:00

English, 05.12.2020 01:00

Biology, 05.12.2020 01:00
Mathematics, 05.12.2020 01:00
Mathematics, 05.12.2020 01:00

History, 05.12.2020 01:00
Mathematics, 05.12.2020 01:00

Health, 05.12.2020 01:00
Mathematics, 05.12.2020 01:00
Mathematics, 05.12.2020 01:00
English, 05.12.2020 01:00
History, 05.12.2020 01:00


