
Mathematics, 08.12.2021 22:50 salsaanddoritos899
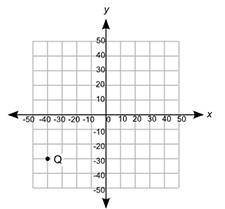
Point Q is plotted on the coordinate grid. Point P is at (20, −30). Point R is vertically above point Q. It is at the same distance from point Q as point P is from point Q. Which of these shows the coordinates of point R and its distance from point Q?
"On a coordinate grid from negative 50 to positive 50 in increments of 10, Point Q is plotted at the ordered pair negative 40, negative 30."/>
On a coordinate grid from negative 50 to positive 50 in increments of 10, Point Q is plotted at the ordered pair negative 40, negative 30.
Point R is at (−40, 30), a distance of 60 units from point Q
Point R is at (−40, −10), a distance of 20 units from point Q
Point R is at (−40, −30), a distance of 60 units from point Q
Point R is at (−40, 10), a distance of 20 units from point Q

Answers: 3


Another question on Mathematics
Mathematics, 21.06.2019 21:10
Mackenzie needs to determine whether the rectangles are proportional. which process could she use? check all that apply.
Answers: 1
Mathematics, 21.06.2019 21:30
Over the course of the school year, you keep track of how much snow falls on a given day and whether it was a snow day. your data indicates that of twenty-one days with less than three inches of snow, five were snow days, while of the eight days with more than three inches of snow, six were snow days. if all you know about a day is that it is snowing, what is the probability that it will be a snow day?
Answers: 1
Mathematics, 21.06.2019 22:00
In dire need~! describe how to use area models to find the quotient 2/3 divided by 1/5. check your work by also finding the quotient 2/3 divided by 1/5 using numerical operations only.
Answers: 3
Mathematics, 21.06.2019 23:00
The weight of a radioactive isotope was 96 grams at the start of an experiment. after one hour, the weight of the isotope was half of its initial weight. after two hours, the weight of the isotope was half of its weight the previous hour. if this pattern continues, which of the following graphs represents the weight of the radioactive isotope over time? a. graph w b. graph x c. graph y d. graph z
Answers: 2
You know the right answer?
Point Q is plotted on the coordinate grid. Point P is at (20, −30). Point R is vertically above poin...
Questions

English, 20.07.2019 02:00

History, 20.07.2019 02:00

Social Studies, 20.07.2019 02:00


Geography, 20.07.2019 02:00
History, 20.07.2019 02:00

Mathematics, 20.07.2019 02:00
History, 20.07.2019 02:00

Business, 20.07.2019 02:00
Health, 20.07.2019 02:00


