
Mathematics, 09.12.2021 18:00 dyalisa15
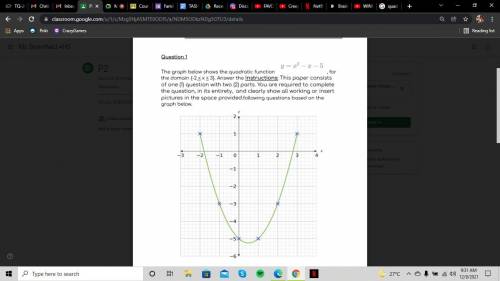
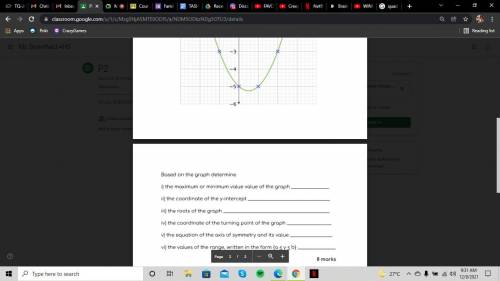
The graph below shows the quadratic function , for the domain {-2 < x < 3}. Answer the Instructions: This paper consists of one (1) question with two (2) parts. You are required to complete the question, in its entirety, and clearly show all working or insert pictures in the space provided. following questions based on the graph below.

Answers: 2


Another question on Mathematics
Mathematics, 20.06.2019 18:02
Which statement best describes the relation between correlation and causation? a. correlation results in causation. b. correlation does nog imply causation. c. correlation and causation are unrelated. d. correlation and causation are the same thing.
Answers: 1
Mathematics, 21.06.2019 13:10
Next, chad created this graph with ordered pairs that show the possible ratios of the number of damage to defense cards in his deck.what error chad make?
Answers: 1
Mathematics, 21.06.2019 22:20
The figure shows triangle def and line segment bc, which is parallel to ef: triangle def has a point b on side de and point c on side df. the line bc is parallel to the line ef. part a: is triangle def similar to triangle dbc? explain using what you know about triangle similarity. part b: which line segment on triangle dbc corresponds to line segment ef? explain your answer. part c: which angle on triangle dbc corresponds to angle f? explain your answer. asap
Answers: 3
Mathematics, 21.06.2019 23:00
Calculate the average rate of change over the interval [1, 3] for the following function. f(x)=4(5)^x a. -260 b. 260 c. 240 d. -240
Answers: 1
You know the right answer?
The graph below shows the quadratic function , for the domain {-2 < x < 3}. Answer the Instruc...
Questions


Computers and Technology, 21.10.2020 20:01
Mathematics, 21.10.2020 20:01
Mathematics, 21.10.2020 20:01

History, 21.10.2020 20:01
Mathematics, 21.10.2020 20:01

Mathematics, 21.10.2020 20:01

Mathematics, 21.10.2020 20:01
Mathematics, 21.10.2020 20:01
Mathematics, 21.10.2020 20:01
Mathematics, 21.10.2020 20:01
History, 21.10.2020 20:01
History, 21.10.2020 20:01


