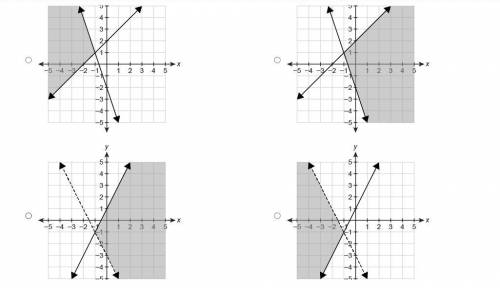
Which graph represents the solution set of the system of inequalities?
{y≤2x+1y>−2x−3...

Mathematics, 11.12.2021 03:40 danielhall
Which graph represents the solution set of the system of inequalities?
{y≤2x+1y>−2x−3

Answers: 1


Another question on Mathematics
Mathematics, 21.06.2019 21:30
Create a graph for the demand for starfish using the following data table: quantity/price of starfish quantity (x axis) of starfish in dozens price (y axis) of starfish per dozen 0 8 2 6 3 5 5 2 7 1 9 0 is the relationship between the price of starfish and the quantity demanded inverse or direct? why? how many dozens of starfish are demanded at a price of five? calculate the slope of the line between the prices of 6 (quantity of 2) and 1 (quantity of 7) per dozen. describe the line when there is a direct relationship between price and quantity.
Answers: 3
Mathematics, 21.06.2019 23:00
Devonte is balancing his checking account. his account statement does not include a deposit of $107.00 that he made on november 1st. what is devonte’s actual account balance?
Answers: 1
You know the right answer?
Questions
Mathematics, 28.08.2020 09:01
Mathematics, 28.08.2020 09:01
Mathematics, 28.08.2020 09:01

Geography, 28.08.2020 09:01

History, 28.08.2020 09:01


History, 28.08.2020 09:01

Mathematics, 28.08.2020 09:01

Mathematics, 28.08.2020 09:01
Medicine, 28.08.2020 09:01
Mathematics, 28.08.2020 09:01


