Mathematics, 12.12.2021 01:20 lilypup004
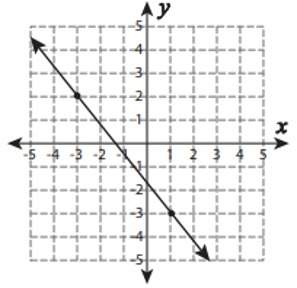
The table shows the difference d (in cents) of this year's average monthly gas price and the previous year's average monthly gas price. For example, in month 1, d=-2. So, the average gas price was 2 cents below the previous year's gas price.
Explain how you know the table represents a function.
Graph the function and identify its domain and range.
What does a point in Quadrant IV mean in terms of this situation?

Answers: 2


Another question on Mathematics


Mathematics, 21.06.2019 17:40
Multiply. write your answer in simplest form. 3/8 x 5/7
Answers: 1

Mathematics, 21.06.2019 22:00
Given that sin∅ = 1/4, 0 < ∅ < π/2, what is the exact value of cos∅? a. (√4)/4 b. (√15)/4 c. (4π)/2 d. (4√2)/4
Answers: 2

Mathematics, 21.06.2019 23:00
Which radical expression is a rational number? a. √ 360 b. √ 644 c. √ 225 d. √ 122
Answers: 1
You know the right answer?
The table shows the difference d (in cents) of this year's average monthly gas price and the previou...
Questions


Social Studies, 12.07.2019 23:00


Mathematics, 12.07.2019 23:00

Mathematics, 12.07.2019 23:00

Mathematics, 12.07.2019 23:00

Mathematics, 12.07.2019 23:00

History, 12.07.2019 23:00

Social Studies, 12.07.2019 23:00

English, 12.07.2019 23:00

Mathematics, 12.07.2019 23:00

History, 12.07.2019 23:00

History, 12.07.2019 23:00

Biology, 12.07.2019 23:00

Mathematics, 12.07.2019 23:00


Mathematics, 12.07.2019 23:00

History, 12.07.2019 23:00


