
Mathematics, 13.12.2021 06:00 mkidgellmas1284
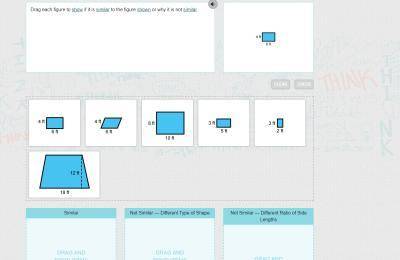
Drag each figure to show if it is similar to the figure shown or why it is not similar. A rectangle measures 4 by 6 feet.

Answers: 1


Another question on Mathematics
Mathematics, 21.06.2019 16:00
Which is the graph of the piecewise function f(x)? f(x)=[tex]f(x) = \left \{ {{-x+1, x\leq 0 } \atop {x+1, x\ \textgreater \ 0}} \right.[/tex]
Answers: 3
Mathematics, 21.06.2019 20:30
Asmall business produces and sells balls. the fixed costs are $20 and each ball costs $4.32 to produce. each ball sells for $8.32. write the equations for the total cost, c, and the revenue, r, then use the graphing method to determine how many balls must be sold to break even.
Answers: 1
Mathematics, 21.06.2019 23:00
Someone answer this asap for the function f(x) and g(x) are both quadratic functions. f(x) = x² + 2x + 5 g(x) = x² + 2x - 1 which statement best describes the graph of g(x) compared to the graph of f(x)? a. the graph of g(x) is the graph of f(x) shifted down 1 units. b. the graph of g(x) is the graph of f(x) shifted down 6 units. c. the graph of g(x) is the graph of f(x) shifted to the right 1 unit. d. the graph of g(x) is the graph of f(x) shifted tothe right 6 units.
Answers: 3
You know the right answer?
Drag each figure to show if it is similar to the figure shown or why it is not similar.
A rectangl...
Questions
Mathematics, 29.01.2020 04:56


Biology, 29.01.2020 04:56
Mathematics, 29.01.2020 04:56


Social Studies, 29.01.2020 04:56

Physics, 29.01.2020 04:56
Mathematics, 29.01.2020 04:56
Mathematics, 29.01.2020 04:56
Mathematics, 29.01.2020 04:56

History, 29.01.2020 04:56
History, 29.01.2020 04:56


Health, 29.01.2020 04:56

Biology, 29.01.2020 04:56


